Wonderful Executive Dashboard PPT and Google Slides

Executive slide showing expense meters, world sales performance, and bar graphs for margin, expenses, and revenue by month.
P.ID : 3921
    377 views
    53 Downloads
    Get Custom Slides by Experts
    Instantly Access Templates in PowerPoint

    Wonderful Executive Dashboard PPT and Google Slides


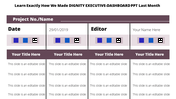
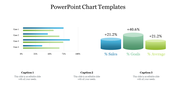
    Empower your executive decisions with our comprehensive dashboard template, meticulously designed to provide invaluable insights at a glance. Featuring four dynamic graphs showcasing margins, expenses, and revenues, this template offers a clear snapshot of your business's financial performance.

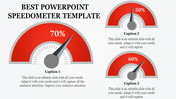
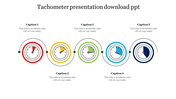
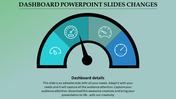
    Utilizing meters and gauges, our template provides an intuitive visualization of key metrics, enabling executives to assess performance trends with ease and precision. Crafted for efficiency and clarity, our template equips executives with the tools they need to make informed decisions and drive strategic initiatives forward.

    Enhancing global perspective, a world map adorned with location icons illuminates revenue streams, imports, and exports. This feature offers a comprehensive overview of your business's geographic reach and market presence. 

    Ideal for executive presentations, board meetings, and financial reviews, our template promises to elevate your analysis and streamline decision-making processes. Download the Executive Dashboard PowerPoint and Google Slides Template today, and harness the power of data-driven insights to propel your business to new heights of success.

    Features of the template

    • 100% customizable slides and easy to download.
    • Slides are available in different nodes & colors.
    • The slide contains 16:9 and 4:3 formats.
    • It is easy to change the colors of the slide quickly. 
    • Well-crafted template with an instant download facility.
    Advertisement

    You May Also Like These PowerPoint Templates

    Add to Wishlist
    Download
    AI Customize
    Our Predesigned Chart Templates PPT Slides Designs
    Add to Wishlist
    Download
    AI Customize
    KWL chart slide with three columns in blue, red, and gold, representing learning insights.
    Add to Wishlist
    Download
    AI Customize
    Infographic with four bar graphs, each showing data points A to D, and captions areas in green boxes.
    Free
    Add to Wishlist
    Download
    AI Customize
    PowerPoint presentation slide featuring a stacked bar chart, aerial landscape photo, and a comparison table of drone data.
    Free
    Add to Wishlist
    Download
    AI Customize
    PowerPoint slide with a circular pie chart showing four segments labeled with percentages and a placeholder text.
    Add to Wishlist
    Download
    AI Customize
    Customized Kubler Ross PowerPoint Presentation Template
    Add to Wishlist
    Download
    AI Customize
    Visual of boost engagement growth with stacked bar categories: newsletter sign-ups, premium customers, and followers.
    Add to Wishlist
    Download
    AI Customize
    Pie charts showing data percentages for growth, with three percentage values with placeholder text.
    Free
    Add to Wishlist
    Download
    AI Customize
    Chart infographic with four drop shaped gauge style meters in blue, green, yellow, and red, each with text below.
    Add to Wishlist
    Download
    AI Customize
    Dual chart template slide with scatter and bubble charts, the scatter chart on the left and the bubble chart on the right.
    Free
    Add to Wishlist
    Download
    AI Customize
    Slide with green and white sections, featuring pie and bar charts, and an engine image in the bottom right corner.
    Add to Wishlist
    Download
    AI Customize
    Chart with five blue vertical bars showing percentages, paired with captions, on a white background.
    Free
    Add to Wishlist
    Download
    AI Customize
    Infographic with a circular segmented chart in blue shades, centered around an AI head graphic placed in white background.
    Add to Wishlist
    Download
    AI Customize
    PowerPoint pie chart template with three segments and associated icons.
    Add to Wishlist
    Download
    AI Customize
    Three vertical rectangular sections with headers in green, blue, and orange, each with captions inside.
    Add to Wishlist
    Download
    AI Customize
    Colorful pie chart PowerPoint slide with five labeled sections and captions on a white backdrop.
    Free
    Add to Wishlist
    Download
    AI Customize
    Pie chart slide with a blue and dark blue donut chart showing 75% sales, two numbered text boxes on the right.