Comprehensive Dashboard PPT Template and Google Slides

Botanical data dashboard template  showing performance metrics for flower species, featuring line and bar charts.
P.ID : 34857
    1.4K+ views
    132 Downloads
    Get Custom Slides by Experts
    Instantly Access Templates in PowerPoint

    Comprehensive Dashboard PPT Template and Google Slides


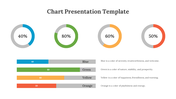
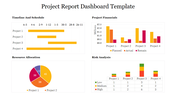
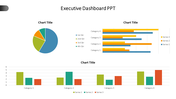
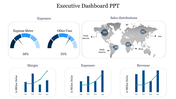
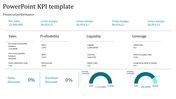
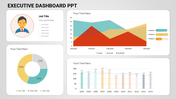
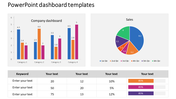
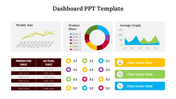
    The Dashboard PowerPoint template and Google Slides theme is a comprehensive tool designed to streamline data visualization and analysis. Featuring three distinct types of graphs like bar, chart, and line. Each graph is meticulously colored with three different hues, ensuring clarity and visual appeal.

    Underneath each graph, detailed statistics are provided, enabling easy comprehension and interpretation for your audience. This template is the perfect solution for showcasing complex statistics in a simplified format, allowing you to convey key insights effectively and efficiently.

    Whether you're presenting financial data, market trends, or performance metrics, this versatile template offers a centralized platform for displaying critical information. With its user-friendly layout and customizable features, you can tailor the dashboard to suit your specific needs and preferences.

    Download this template now to elevate your data-driven presentations and empower your audience with actionable insights. With its intuitive design and visual clarity, it's the ideal solution for transforming complex data into actionable intelligence.

    Features of the template

    • 100% customizable slides and easy to download.
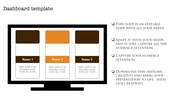
    • Slides are available in different nodes & colors.
    • The slide contains 16:9 and 4:3 formats.
    • It is easy to change the colors of the slide quickly. 
    • Well-crafted template with an instant download facility.
    Advertisement

    You May Also Like These PowerPoint Templates

    Add to Wishlist
    Download
    AI Customize
    Dashboard gauges with red, yellow, green indicators showing low, medium, high performance against a gray background.
    Free
    Add to Wishlist
    Download
    AI Customize
    Pie chart in orange, red, green, and blue sections with two text labels on either side, highlighting sales performance.
    Free
    Add to Wishlist
    Download
    AI Customize
    Business pie chart template with a car background, featuring sections labeled with text and pie chart values.
    Free
    Add to Wishlist
    Download
    AI Customize
    Marketing plan slide showing green bar chart with upward arrow, alongside three text and icons.
    Add to Wishlist
    Download
    AI Customize
    KPI dashboard slide with key metrics for business, development, and downloads, showing percentages with icons.
    Add to Wishlist
    Download
    AI Customize
    Customized PowerPoint Charts Template Presentation
    Add to Wishlist
    Download
    AI Customize
    Colorful pie chart with six segments, each labeled with percentages and color-coded text on the right.
    Add to Wishlist
    Download
    AI Customize
    A dashboard PPT slide with bar charts for Zantedeschia, Celosia, and Calendula, and three colorful gauge indicators.
    Add to Wishlist
    Download
    AI Customize
    Attractive PowerPoint KPI Dashboard Presentation Template
    Add to Wishlist
    Download
    AI Customize
    Dashboard presentation slide with a line chart trend and circular charts highlighting project progress percentages.
    Free
    Add to Wishlist
    Download
    AI Customize
    Five vertical purple bars in a row, each on a gray base, with a businesswoman figure on the right side.
    Free
    Add to Wishlist
    Download
    AI Customize
    Template with six green bar graphs labeled by years from 2016 to 2021, and a woman in a formal outfit.
    Free
    Add to Wishlist
    Download
    AI Customize
    Bar chart comparing business targets and profits across quarters, with orange and blue bars labeled by month.
    Add to Wishlist
    Download
    AI Customize
    Budget slide featuring a colorful donut chart with percentages and five categories with placeholder text.
    Add to Wishlist
    Download
    AI Customize
    Colorful pie chart in PowerPoint slide showing 60, 30, and 10 percent segments with text boxes on a white backdrop.
    Free
    Add to Wishlist
    Download
    AI Customize
    Five triangular red pyramids arranged by size with corresponding percentage values, set against a minimalist gray background.
    Add to Wishlist
    Download
    AI Customize
    Company annual report slide featuring financial data including net income, assets, deposits, and shareholders' equity.
    Add to Wishlist
    Download
    AI Customize
    Animated slide design with orange gradient sidebar and three bar charts in blue, yellow, and green for different years.
    Add to Wishlist
    Download
    AI Customize
    Slide with a pie chart and a numbered list of five levels, each in orange, red, blue, green, and yellow.