Free - Editable Annual Report Presentation Template - Pie Chart

Free
An annual sales template with sections labeled Heading 1 to 5 and a pie chart illustrating various percentages with text.
P.ID : 4217
    533 views
    92 Downloads
    Get Custom Slides by Experts
    Instantly Access Templates in PowerPoint

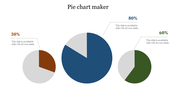
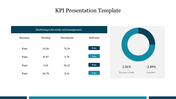
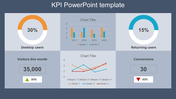
    Practical Annual Report PowerPoint Template


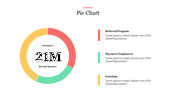
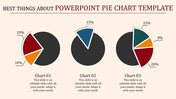
    Download our Annual Report Presentation Template, which is crafted for finance professionals, executives, and presenters aiming to convey complex data effortlessly. This template features a vibrant pie chart with five sections, each accompanied by percentage levels, headings, and text areas.

    Ideal for presenting financial performance, market shares, or strategic insights, this slide provides a visually appealing canvas to showcase your annual data. The text areas offer a seamless space to add detailed information, ensuring a comprehensive understanding.

    Ready to redefine your annual reporting? Click now to access the Annual Report Templates, where financial precision meets visual sophistication. Propel your presentations, engage your stakeholders, and convey your annual data with confidence. Your journey to impactful financial storytelling starts here!

    Features of the template


    • 100% customizable slides are easy to download.
    • Slides are available in different colors.
    • The slide has 4:3 and 16:9 formats.
    • It is easy to change the slide colors quickly.
    • It has a cute design to impress an audience.
    • Create feature-rich, animated presentations.
    Advertisement

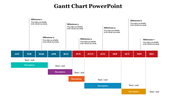
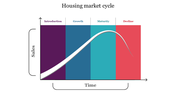
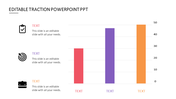
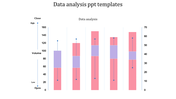
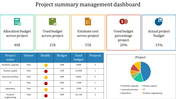
    You May Also Like These PowerPoint Templates

    Add to Wishlist
    Download
    AI Customize
    Area chart with a teal base and five markers in yellow, red, and maroon shades representing growth percentages.
    Add to Wishlist
    Download
    AI Customize
    Awesome Dashboard PPT Template Free Download Slides
    Add to Wishlist
    Download
    AI Customize
    Pie Chart PowerPoint with Segmented Circles Slides
    Add to Wishlist
    Download
    AI Customize
    Template displaying a structured flowchart for KPI types, categorized into qualitative and quantitative evaluations.
    Add to Wishlist
    Download
    AI Customize
    Four segmented doughnut charts in yellow, red, purple, and blue with black circular labels, percentage values, and captions.
    Add to Wishlist
    Download
    AI Customize
    Illustration of a chart with yellow, red, and green horizontal bars displaying percentages and paper boat icons on waves.
    Add to Wishlist
    Download
    AI Customize
    KPI dashboard showcasing private school growth with yellow bar charts indicating critical, low, none, and high levels.
    Add to Wishlist
    Download
    AI Customize
    A vertical green color bar chart slide displaying loss data from 2014 to 2019, with the title at the top.
    Add to Wishlist
    Download
    AI Customize
    Dashboard slide showing colour coded plant growth chart with progress ring visuals and percentages.
    Add to Wishlist
    Download
    AI Customize
    Dashboard slide showing sales bar chart with a highlighted value and a gauge representing business metrics.
    Add to Wishlist
    Download
    AI Customize
    A colorful pie chart diagram with concentric circles showing percentages for different data categories in 2021.
    Free
    Add to Wishlist
    Download
    AI Customize
    Map-based analysis design with statistical data visuals including circular graphs and demographic distributions.
    Add to Wishlist
    Download
    AI Customize
    KPI dashboard layout with blue and green line graphs at the top and shaded bar charts at the bottom in gradient colors.
    Free
    Add to Wishlist
    Download
    AI Customize
    Gantt chart slide showing six tasks with progress bars, each reflecting completion levels ranging from 30% to 80%.
    Add to Wishlist
    Download
    AI Customize
    Four orange pie charts with center numbers from 01 to 04, each with text placeholders on the right.
    Free
    Add to Wishlist
    Download
    AI Customize
    Line chart showing traction growth with two labeled data points in green and blue, alongside thumbs up and thumbs down icons.
    Add to Wishlist
    Download
    AI Customize
    Microsoft PowerPoint slide featuring three donut charts in yellow, orange, and pink, each with different percentage values.
    Add to Wishlist
    Download
    AI Customize
    Business chart with three line graphs representing data over four years, and yellow, red, and purple captions.
    Add to Wishlist
    Download
    AI Customize
    Horizontal Gantt chart with blue bars representing tasks, timeline from March to April 2020, and gray grid lines.