Best Pie Chart Template PowerPoint And Google Slides


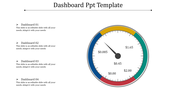

Simple Pie Chart Template PPT Presentation
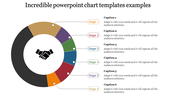
Ever struggle to explain data with confusing spreadsheets? We've all been there. Leave the headache and grab this pie chart template for PowerPoint and Google Slides!
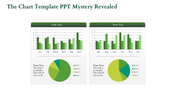
This isn't your average template. It's got four vibrant pie charts, each with its title, caption, and text area. Simply plug in your data and watch your information come alive! The bold red color scheme grabs attention, making sure your key points shine. Plus, the clean white background keeps things clutter-free.
Teachers, students, business whizzes, non-profits – this template's for you! No more wasting hours building charts from scratch. This template is your secret weapon for creating impactful presentations in minutes.
Download this pie chart template today and transform your next presentation from yawn-fest to wow-factor!
Features of the template
- 100% customizable slides and easy to download.
- The slides contain 16:9 and 4:3 formats.
- Easy to change the colors quickly.
- It is a well-crafted template with an instant download facility.
- It is a 100% pre-designed slide.
- The slide holds vibrant colors.


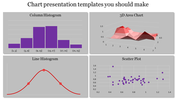
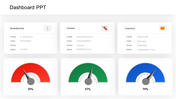
You May Also Like These PowerPoint Templates
Add to Wishlist
Download
Edit

Add to Wishlist
Download
Edit

Add to Wishlist
Download
Edit

Add to Wishlist
Download
Edit


Add to Wishlist
Download
Edit


Add to Wishlist
Download
Edit

Add to Wishlist
Download
Edit

Add to Wishlist
Download
Edit

Add to Wishlist
Download
Edit

Add to Wishlist
Download
Edit

Add to Wishlist
Download
Edit


Add to Wishlist
Download
Edit

Add to Wishlist
Download
Edit

Add to Wishlist
Download
Edit

