Innovative Executive Dashboard PowerPoint Templates

Executive dashboard with four blue horizontal boxes containing text and a smiling cartoon man gesturing on the right.
P.ID : 3939
    618 views
    40 Downloads
    Get Custom Slides by Experts
    Instantly Access Templates in PowerPoint

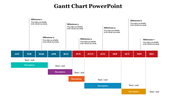
    Project Plan Presentation Template 


    Welcome to our Executive Dashboard PowerPoint templates – the game-changer for your presentations! Imagine a presentation that not only looks sleek but also effortlessly conveys your message. Our templates are designed to do just that.

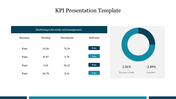
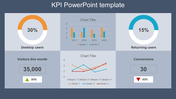
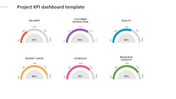
    In the image above, you get a sneak peek of what's inside – a user-friendly executive dashboard slide that makes presenting key metrics a breeze. Perfect for professionals, educators, and students, it's a versatile tool that adds a touch of professionalism to your slides.

    Why choose these templates? They're not just visually appealing; they're practical too. Customization is a cinch, allowing you to tailor the dashboard to your specific needs without a hassle.

    Executives, educators, and students – these templates are for you. Transform your data into engaging visuals, whether it's for a business report, class presentation, or a project update. Stay ahead by presenting information in a way that's not just informative but also easy on the eyes.

    Ready to level up your presentations? Dive into the world of our Executive Dashboard PowerPoint templates now. 
    Advertisement

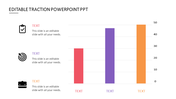
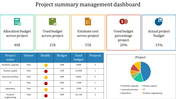
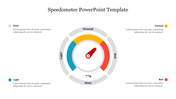
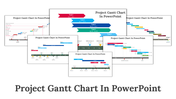
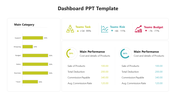
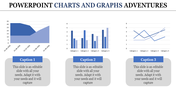
    You May Also Like These PowerPoint Templates

    Add to Wishlist
    Download
    AI Customize
    Three pie charts with segmented sections and percentage labels, each chart featuring placeholder text below.
    Add to Wishlist
    Download
    AI Customize
    Tachometer slide featuring a dial with a needle pointing to colored segments and four caption areas.
    Add to Wishlist
    Download
    AI Customize
    A pie chart template with three circular charts representing each with text and icons beside them.
    Add to Wishlist
    Download
    AI Customize
    Set of three speedometer gauges indicating 70%, 50%, and 55%, with placeholder text areas placed in a white backdrop.
    Add to Wishlist
    Download
    AI Customize
    Central black speedometer with four surrounding colored icons, each detailing various aspects of kilometers.
    Add to Wishlist
    Download
    AI Customize
    Area chart with a teal base and five markers in yellow, red, and maroon shades representing growth percentages.
    Add to Wishlist
    Download
    AI Customize
    Awesome Dashboard PPT Template Free Download Slides
    Add to Wishlist
    Download
    AI Customize
    Pie Chart PowerPoint with Segmented Circles Slides
    Add to Wishlist
    Download
    AI Customize
    Template displaying a structured flowchart for KPI types, categorized into qualitative and quantitative evaluations.
    Add to Wishlist
    Download
    AI Customize
    Dashboard template showing a line chart of page likes over months with marked events in June and August.
    Add to Wishlist
    Download
    AI Customize
    Executive dashboard slide with a colorful line chart for yearly performance.
    Add to Wishlist
    Download
    AI Customize
    Illustration of a chart with yellow, red, and green horizontal bars displaying percentages and paper boat icons on waves.
    Add to Wishlist
    Download
    AI Customize
    Dashboard Model PowerPoint slide showing statistics, graphs, and icons representing business data analysis.
    Add to Wishlist
    Download
    AI Customize
    KPI dashboard showcasing private school growth with yellow bar charts indicating critical, low, none, and high levels.
    Add to Wishlist
    Download
    AI Customize
    Dashboard slide with six gauge meters displaying low to high ranges, each labeled with captions below.
    Add to Wishlist
    Download
    AI Customize
    A vertical green color bar chart slide displaying loss data from 2014 to 2019, with the title at the top.
    Add to Wishlist
    Download
    AI Customize
    Donut chart with four colorful quadrants and text placeholders, connected by lines to circular percentage labels around it.
    Add to Wishlist
    Download
    AI Customize
    A colorful pie chart diagram with concentric circles showing percentages for different data categories in 2021.