Try Our Project Dashboard PowerPoint Presentation Template

Project dashboard with pie, funnel, and bar charts displaying data for various categories and quarters.
P.ID : 6665
    768 views
    54 Downloads
    Get Custom Slides by Experts
    Instantly Access Templates in PowerPoint

    Project Dashboard Presentation Template


    Are you ready to revolutionize the way you present data? Our Dashboard PowerPoint presentation template is your gateway to creating compelling and insightful presentations.

    Slide Description:

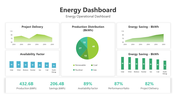
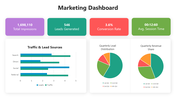
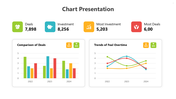
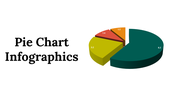
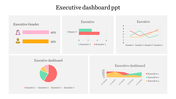
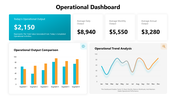
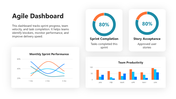
    Our template features a pie chart with segments labeled 1st Qtr, 2nd Qtr, 3rd Qtr, and 4th Qtr. A bar chart showing multiple bars across three series, each representing different categories. These charts allow for easy comparison and visualization of project performance. Below the charts, there’s a horizontal bar graph with five categories (labeled Category 1 to Category 5). Corresponding values (ranging from 1000 to 5000) are displayed next to each bar.


    Purpose of this slide:

    To provide an organized and concise way to present project data during meetings or presentations.


    Who can benefit?

    Project Managers: They can use this template to track KPIs, monitor progress, and communicate project status effectively. Team Members: It helps team members understand project trends and identify areas for improvement. Stakeholders: They can assess project health and make informed decisions based on the visualized data.


    Download now!


    Features of the template:


    •  Slides are available in 4:3 & 16:9
    • Well-crafted template with instant download.
    • Get slides that are 100% customizable and easy to download
    Advertisement

    You May Also Like These PowerPoint Templates

    Add to Wishlist
    Download
    AI Customize
    Line chart with labeled high and low points across a fluctuating path, illustrating peaks and troughs in data trends.
    Add to Wishlist
    Download
    AI Customize
    Line chart template with two lines and labeled data points, along with caption blocks on the left.
    Add to Wishlist
    Download
    AI Customize
    A green circular pie chart showing percentage, and four colored sales data graphs for different years.
    Add to Wishlist
    Download
    AI Customize
    A line graph showing a plot structure with key points marked by colored dots, representing key stages.
    Add to Wishlist
    Download
    AI Customize
    SEO marketing plan template with icons representing different elements like e-commerce, email, and global marketing.
    Add to Wishlist
    Download
    AI Customize
    A donut chart with multiple segments in different colors next to a table displaying statistics and percentage changes.
    Add to Wishlist
    Download
    AI Customize
    Slide deck showcasing various pie chart infographics in different colors and sections for data visualization.
    Free
    Add to Wishlist
    Download
    AI Customize
    Slide deck showcasing KWL chart layouts with colorful sections in purple, yellow, and teal, for structured insights.
    Add to Wishlist
    Download
    AI Customize
    Chart guide slide with two green-tone line graphs displaying data points, captions on the right, and a text footer.
    Free
    Add to Wishlist
    Download
    AI Customize
    Pie chart illustration showcasing five data segments in varying colors with percentage labels and connected captions areas.
    Add to Wishlist
    Download
    AI Customize
    Vertical Microsoft infographic with four colored arrows each labeled with icons for business, target, analytics, and money.
    Add to Wishlist
    Download
    AI Customize
    Steps to growth slide featuring a chart with four arrows indicating yearly growth percentages and a large text section.
    Free
    Add to Wishlist
    Download
    AI Customize
    Comparison bar chart showing percentage values from 2011 to 2019 for chat and security categories.
    Add to Wishlist
    Download
    AI Customize
    Infographic bar chart slide displaying daily comparisons for Business System and Supplier metrics.
    Add to Wishlist
    Download
    AI Customize
    Slide showcasing four circular progress charts with percentages in alternating teal and black accents.
    Add to Wishlist
    Download
    AI Customize
    Comparison chart with horizontal green bars displaying data for four examples across three series.
    Add to Wishlist
    Download
    AI Customize
    Pie chart highlighting percentages for four steps with a caption areas in a circular layout placed in a grey backdrop.
    Free
    Add to Wishlist
    Download
    AI Customize
    A slide showing a colorful KWL chart with sections for knowledge, inquiry, and learning outcomes with placeholder text.
    Free
    Add to Wishlist
    Download
    AI Customize
    Pie chart presentation slide showing three charts with percentages with text placeholders.