Plot Chart — Edit and Present


Plot Chart — PowerPoint Template
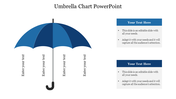
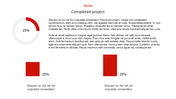
Spending hours building slides from scratch is time you don't have. A ready-made, fully editable template gets you to a polished presentation in minutes — not hours.
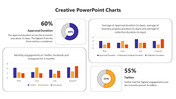
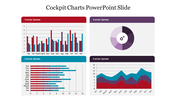
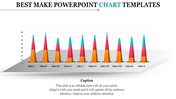
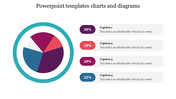
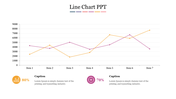
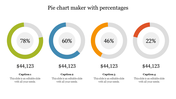
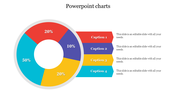
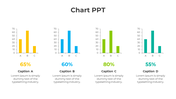
This Plot Chart gives you a clean, fully editable presentation slide that's ready to use the moment you download it. The slide features a line graph showing a plot structure with key points marked by colored dots, representing key stages. Drop it into your deck, replace the placeholder text, and you're done.
What's Inside
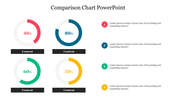
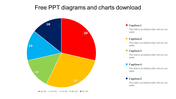
A focused single-slide design — built for one strong visual message, fast to customize — text, colors, icons, and layout are all yours to adjust. Design variations include: Plot structure, Elements of a plot diagram, Plot Pyramid Shape, Plot Chart. Match your brand, adapt the layout, change the colors — it takes minutes, not hours.
Who This Is For
Built for professionals, students, educators, and anyone who needs a polished, ready-to-use presentation template. No design background needed — just open, edit, and present.
Formats & Download
Available for PowerPoint. Download instantly — no design skills required. Everything is fully customizable to match your brand or topic.
Key Features
- Fully editable — text, colors, icons, and layout
- Compatible with PowerPoint
- 16:9 widescreen format — presentation-ready
- Clean, professional design — no clutter
- Premium — instant download access
Explore more Chart templates to find the right fit for your next presentation.


You May Also Like These PowerPoint Templates


