Get This Charts PowerPoint And Google Slides Template

Creative charts showing a circular 60% approval metric, bar graphs, and a 55% Twitter engagement donut chart.
P.ID : 11872
    1K+ views
    125 Downloads
    Get Custom Slides by Experts
    Instantly Access Templates in PowerPoint

    Creative Charts PowerPoint Template


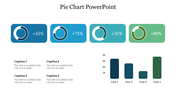
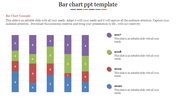
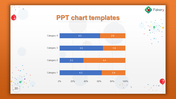
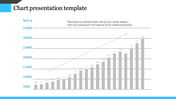
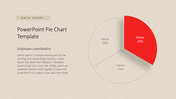
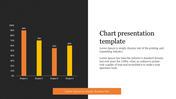
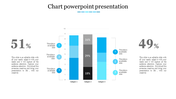
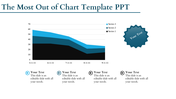
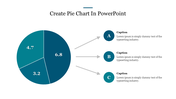
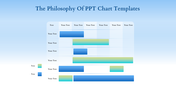
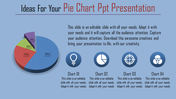
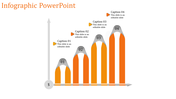
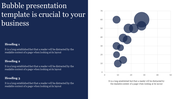
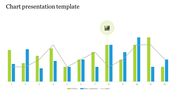
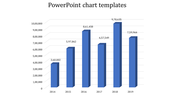
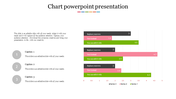
    Charts serve as graphical representations of data, offering a visual summary to aid in understanding and analysis across various industries such as business, finance, marketing, education, and research. They encompass different types, including bar charts, line charts, and pie charts, each tailored to convey distinct data patterns, trends, and relationships effectively. Essential for presenting complex information in a clear, concise, and visually appealing manner, charts enable viewers to quickly grasp insights and make informed decisions. This template provides professionals with customizable chart templates to create impactful presentations, allowing for effective data visualization and presentation of key insights. With fully editable slides, users can tailor chart styles, colors, and labels to their specific needs, enhancing clarity and engagement while saving time in presentation creation. Encourage the audience to utilize this template to enhance their presentations, effectively communicate data-driven insights, and captivate their audience with compelling visuals that support informed decision-making processes.


    Features of this template


    • 100% customizable slides and easy to download.
    • The slide contains 16:9 and 4:3 formats.
    • Easy to change the colors of the slide quickly.
    • Highly compatible with PowerPoint and Google Slides.
    • Well-crafted template with an instant download facility.
    • Quick and easy edit features. 
    Advertisement

    You May Also Like These PowerPoint Templates

    Add to Wishlist
    Download
    AI Customize
    Slide deck with multiple circular progress bars in various colors, showing percentages and captions below.
    Add to Wishlist
    Download
    AI Customize
    Slide with a horizontal bar chart on the left and 3D cylindrical percentage charts in blue, green, and teal, on the right.
    Add to Wishlist
    Download
    AI Customize
    Horizontal bar chart with four labeld sections A to D, in purple, pink, teal, and blue, and captions below.
    Add to Wishlist
    Download
    AI Customize
    Business chart slide with a red and black line graph on the left, a red bar chart on the right, and two description sections.
    Free
    Add to Wishlist
    Download
    AI Customize
    Purple bar chart PPT slide with years 2018 to 2021 and percentages and a businesswoman presenting the information.
    Free
    Add to Wishlist
    Download
    AI Customize
    Layered area chart with Series 1 in yellow, Series 2 in orange, and Series 3 in black, showing data trends over time.
    Add to Wishlist
    Download
    AI Customize
    Clustered bar chart comparing data across quarters with horizontal bars in various colors.
    Add to Wishlist
    Download
    AI Customize
    Slide with three vertical boxes in blue, red, and green banners, and rounded icons labeled K, W, and L for learning stages.
    Add to Wishlist
    Download
    AI Customize
    PowerPoint chart template showing stacked bar graphs with different categories and values for each year from 2016 to 2019.
    Add to Wishlist
    Download
    AI Customize
    Line graph infographic showing data from 2015 to 2020, with three colored lines in purple, yellow, and green, and text.
    Add to Wishlist
    Download
    AI Customize
    Donut chart in blue and orange displaying percentage, with matching colored caption boxes on either side.
    Add to Wishlist
    Download
    AI Customize
    Our Predesigned Chart Templates PPT Slides Designs
    Add to Wishlist
    Download
    AI Customize
    KWL chart slide with three columns in blue, red, and gold, representing learning insights.
    Add to Wishlist
    Download
    AI Customize
    Infographic with four bar graphs, each showing data points A to D, and captions areas in green boxes.
    Free
    Add to Wishlist
    Download
    AI Customize
    PowerPoint presentation slide featuring a stacked bar chart, aerial landscape photo, and a comparison table of drone data.
    Free
    Add to Wishlist
    Download
    AI Customize
    PowerPoint slide with a circular pie chart showing four segments labeled with percentages and a placeholder text.
    Add to Wishlist
    Download
    AI Customize
    Customized Kubler Ross PowerPoint Presentation Template