Pie Chart PPT Presentation Template for Data Visualization

Pie chart with colorful segments representing percentages and icons below, illustrating key presentation ideas.
P.ID : 15629
    658 views
    30 Downloads
    Get Custom Slides by Experts
    Instantly Access Templates in PowerPoint

    Pie Chart PowerPoint Template and Google Slides

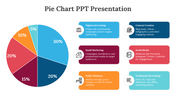
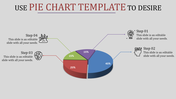
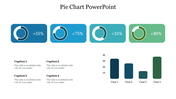
    The Pie Chart PowerPoint Template and Google Slides provide a versatile platform for presenting data and statistics in a visually appealing manner. The slide features a pie chart divided into four segments, each representing different data categories. Titled "Ideas for Your Pie Chart Ppt Presentation," the chart is complemented by four icons—a light bulb, a pie chart, a target, and a group of people—enhancing the visual impact of the presentation against a blue background.

    This template is perfect for professionals, educators, analysts, and researchers who need to showcase data trends, distribution, or comparison in presentations. It's suitable for business reports, academic lectures, project proposals, or marketing presentations requiring clear and concise visualization of data.

    Compatible with PowerPoint and Google Slides for seamless integration into presentations. Available in "16:9" and "4:3" aspect ratios, as well as zip formats, ensuring compatibility with various devices and software. Free and fully customizable, allowing users to modify colors, fonts, and data labels to suit their specific presentation needs. Download this free, customizable template now and captivate your audience with impactful presentations!
    Advertisement

    You May Also Like These PowerPoint Templates

    Add to Wishlist
    Download
    AI Customize
    Pie chart slide showing company expansion with categories like insurance, transport, loan, children, and home utilities.
    Add to Wishlist
    Download
    AI Customize
    Pie chart and bar chart comparison with five sections labeled by percentages and matching text descriptions on the left.
    Add to Wishlist
    Download
    AI Customize
    Circular blue pie chart for 2019 with four captions on the left connected by lines on a gray geometric background.
    Add to Wishlist
    Download
    AI Customize
    Pie chart PPT slide with segments in blue, green, orange, and yellow, showing percentages and a central figure icon.
    Free
    Add to Wishlist
    Download
    AI Customize
    Colorful pie chart on the left showing three segments in green, blue, and yellow, with descriptive text on the right.
    Add to Wishlist
    Download
    AI Customize
    Circular pie chart with four sections in yellow, red, purple, and blue, showing percentages and placeholder text.
    Free
    Add to Wishlist
    Download
    AI Customize
    Pie chart with five equal sections in blue and teal, each labeled with captions and arrows pointing to descriptions.
    Add to Wishlist
    Download
    AI Customize
    Color coded diagram illustrating viva networking with five categories in blue and green tones, arranged in a circular layout.
    Free
    Add to Wishlist
    Download
    AI Customize
    Annual colorful pie chart slide showing a breakdown of a company’s yearly expansion by categories on a blue theme.
    Free
    Add to Wishlist
    Download
    AI Customize
    Chart template with a central circle and four speech bubbles with each holdoing a placeholder text areas.
    Add to Wishlist
    Download
    AI Customize
    Progress chart slide showing four colorful circular charts labeled from business to report with varying percentages and text.
    Add to Wishlist
    Download
    AI Customize
    Three segment pie chart in shades of red and orange with percentages, aligned next to three captions on the right.
    Add to Wishlist
    Download
    AI Customize
    Colorful pie chart slide showing five distinct stages with varying percentage values each with numbered placeholder text.
    Free
    Add to Wishlist
    Download
    AI Customize
    A pie chart slide is divided into five colorful sections and icons, each with a number and connected to descriptive captions.
    Free
    Add to Wishlist
    Download
    AI Customize
    Smart pie chart with five segments in different colors, displaying percentages, with three placeholder text to the right.
    Free
    Add to Wishlist
    Download
    AI Customize
    Four circular progress graphs in blue, orange, red, and green, each showing percentages and captions.
    Add to Wishlist
    Download
    AI Customize
    Chart maker slide with a 3D pie chart labeled for each quarter and four editable text boxes on the right side.
    Free
    Add to Wishlist
    Download
    AI Customize
    Colorful pie chart slide showing five segments with percentages, paired with four content boxes for additional information.