Pie Chart PowerPoint with Segmented Circles Slides

Pie Chart PowerPoint with Segmented Circles Slides
P.ID : 13059
    1.7K+ views
    216 Downloads
    Get Custom Slides by Experts
    Instantly Access Templates in PowerPoint

    Pie Chart PowerPoint Templates and Google Slide Themes


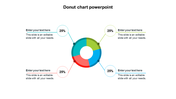
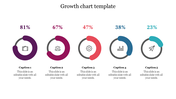
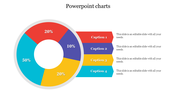
    Crafted for modern communicators, this versatile tool presents data with finesse. Each slice, a story; each segment, a narrative waiting to unfold. Explore the five nodes, each boasting a captivating blend of caption, title holder, and text area—perfect for elucidating your insights.

    Targeting analysts, educators, and entrepreneurs, this template empowers presentations with clarity and impact. With an intuitive interface and seamless integration, transform raw data into compelling narratives effortlessly. Bid adieu to mundane presentations; embrace the future of visual storytelling.

    Improve your discourse, captivate your audience, and leave a lasting impression. Experience the power of persuasion with our Pie Chart PowerPoint Template and Google Slides Themes today!

    Download Now

    Features of the Template

    • 100 % customizable slides.
    • The slide show is in 4:3, 16:9, zip format.
    • There is powerful connectivity with Google Slides and PowerPoint.
    • It is simple and quick to alter the slide's color.
    • An efficient template that can be easily accessed immediately.
    • Well-crafted template with an instant download facility.
    • Highly compatible with PowerPoint, Google Slides and Canva templates
    Advertisement

    You May Also Like These PowerPoint Templates

    Add to Wishlist
    Download
    AI Customize
    Six panel infographic featuring KPI metrics with colorful charts, graphs, and numerical data insights.
    Add to Wishlist
    Download
    AI Customize
    Creative charts showing a circular 60% approval metric, bar graphs, and a 55% Twitter engagement donut chart.
    Free
    Add to Wishlist
    Download
    AI Customize
    PPT slide with a yellow bar chart showing percentages for the years 2016 to 2021 with a woman standing next to the chart.
    Free
    Add to Wishlist
    Download
    AI Customize
    Gantt chart plan template showing tasks across months with a colorful circular pie chart and matching bars on theright.
    Free
    Add to Wishlist
    Download
    AI Customize
    Bar chart comparing metrics over years alongside a diagram linking manager, idea, and management to business growth.
    Add to Wishlist
    Download
    AI Customize
    Project schedule slide with a Gantt chart displaying tasks, timelines, and completion percentages.
    Free
    Add to Wishlist
    Download
    AI Customize
    Horizontal Gantt chart showing tasks by days with segments in blue, purple, and black, indicating task progress and status.
    Add to Wishlist
    Download
    AI Customize
    Funnel infographic with blue, red, yellow, and green sections, each with icons, connected to text descriptions.
    Free
    Add to Wishlist
    Download
    AI Customize
    Four vertical orange columns and percentages, labeled by year, along with a businesswoman illustration on the right.
    Free
    Add to Wishlist
    Download
    AI Customize
    3D green pie chart infographic divided into four steps of varying heights, with numbered labels and descriptions around it.
    Free
    Add to Wishlist
    Download
    AI Customize
    Annual report slide with orange bar graphs showing percentage growth from 2014 to 2021, paired with captions on the left.
    Add to Wishlist
    Download
    AI Customize
    Gantt chart PPT slide displaying tasks with start and end dates, milestones, and progress tracking for each month.
    Add to Wishlist
    Download
    AI Customize
    Infographic chart with a truck carrying five colorful blocks and percentage bars, using green, orange, and brown tones.
    Add to Wishlist
    Download
    AI Customize
    Gantt chart slide with monthly columns showing project tasks and subtasks progress using blue shades to indicate status.
    Free
    Add to Wishlist
    Download
    AI Customize
    Gantt chart slide with monthly timeline across three teams, using blue, orange, and green bars to indicate priority items.
    Free
    Add to Wishlist
    Download
    AI Customize
    Vertical bars in purple, blue, green, yellow, orange, and pink showing percentages, next to a businesswoman.
    Add to Wishlist
    Download
    AI Customize
    Dark themed data dashboard with blue line and bar charts, a circular stat gauge, and numerical metrics for analysis.
    Free
    Add to Wishlist
    Download
    AI Customize
    A detailed Gantt chart slide illustrating project timelines with tasks spanning different durations for 2021 and 2022.