Elegant PPT Chart Templates Slide Design-Blue Color


Effective PPT Chart Template
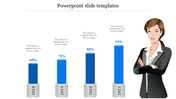
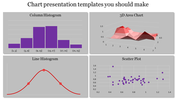
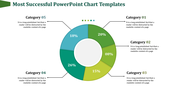
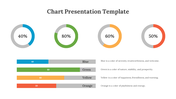
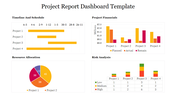
In a fast-paced presentation world where people’s attention can be like a flashlight, you need special tools. The image captures your audience’s interest from the beginning, creating a visual delight that sticks with them. Introducing our PowerPoint chart templates – optimized to turn ordinary data into interesting information. Displays a bar chart with placeholder text. The bar chart shows four different colors (blue, green, light blue, dark blue). Each bar represents a range or data point. Placeholder text such as “Your Text” indicates where explanations or data can be added. This slide will be useful for business professionals, educators, students, entrepreneurs, and creatives. It saves you time and effort. Explore our collection of PowerPoint chart templates today to find the perfect one for your needs. Download now and start building!
Features of the template:
- Slides are available in 4:3 & 16:9
- Well-crafted template with instant download.
- Get slides that are 100% customizable and easy to download!


You May Also Like These PowerPoint Templates


