Analysis Dashboard PowerPoint Template Slide

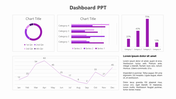
Business Dashboard Presentation Slide
Ever envisioned transforming raw data into a captivating visual story? Immerse yourself in the realm of dynamic presentations with our remarkable Dashboard PowerPoint Templates. Picture crafting a narrative that goes beyond mere numbers, weaving your data into a compelling story that captivates and engages. As a content creator, you possess the ability to elevate information into an art form, and our extensive collection of free dashboard PowerPoint templates offers an artistic toolkit like no other.Imagine being the master storyteller, guiding your audience through the intricate landscapes of business insights, sales trends, and project management milestones. Embrace the sophistication of our business dashboard PowerPoint templates, or explore the realm of data visualization with a myriad of captivating options. Enrich your executive discussions with templates designed to highlight key metrics, or elevate your sales pitches with customizable slides.
Let your project management expertise shine through with a variety of unique templates. Every click, every slide becomes a brushstroke on the canvas of your narrative.Empower your presentations with visuals that speak louder than words. Invite your audience to witness the transformation – not just a PowerPoint but a visual symphony. Choose our Dashboard PowerPoint Templates, where each icon and every text area is a note in the melody of your story. Let the data dance, and the insights sing. Your audience won't just view; they will experience. The question is not whether to use these templates; the question is, can you afford not to? Embrace the power, and let your data-driven story unfold with our Dashboard PowerPoint Templates. Your narrative awaits its visual masterpiece!
Features of the template
- 100% customizable slides and easy to download.
- Slides are available in different colors
- The slide has 4:3 and 16:9 formats.
- Easy to change the slide colors quickly.
- Appealing Presentation to impress an audience.
- Create feature-rich slide presentations.
- An eye-pleasing color slide helps to give a catchy display.
- Highly compatible with PowerPoint and Google Slides.


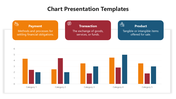
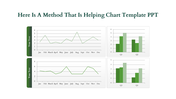
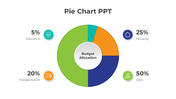
You May Also Like These PowerPoint Templates
Add to Wishlist
Download
AI Customize


Add to Wishlist
Download
AI Customize

Add to Wishlist
Download
AI Customize

Free
Add to Wishlist
Download
AI Customize

Add to Wishlist
Download
AI Customize

Add to Wishlist
Download
AI Customize

Add to Wishlist
Download
AI Customize

Add to Wishlist
Download
AI Customize

Add to Wishlist
Download
AI Customize


Add to Wishlist
Download
AI Customize

Add to Wishlist
Download
AI Customize

Add to Wishlist
Download
AI Customize

Add to Wishlist
Download
AI Customize

Add to Wishlist
Download
AI Customize

Add to Wishlist
Download
AI Customize

Add to Wishlist
Download
AI Customize

Add to Wishlist
Download
AI Customize

Add to Wishlist
Download
AI Customize
