PowerPoint Speedometer Templates and Themes

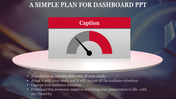
Speedometer PowerPoint Template and Google Slides Themes
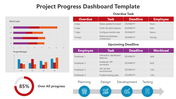
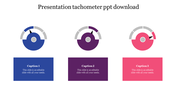
Navigate your presentation with precision using the Speedometer PowerPoint Template and Google Slides Themes. Each slide is meticulously designed with nodes, featuring captivating captions, a title holder for emphasis, and ample space for your key points. Ideal for business reports, project updates, or performance reviews, this template is a game-changer for professionals seeking dynamic visuals.
Whether you're in sales, marketing, or management, this template offers a fresh approach to engaging your audience effortlessly. Leave outdated content in the rear view mirror and embrace a new era of impactful presentations.
Gear up for success with the Speedometer PowerPoint Template and accelerate your presentation prowess. Download now and revitalize your presentations with the Speedometer PowerPoint Template and Google Slides Themes!
Features of the Template
- 100 % customizable slides.
- The slide show is in 4:3, 16:9, zip format.
- There is powerful connectivity with Google Slides and PowerPoint.
- It is simple and quick to alter the slide's color.
- An efficient template that can be easily accessed immediately.
- Well-crafted template with an instant download facility.


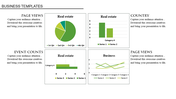
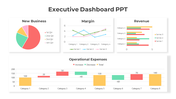
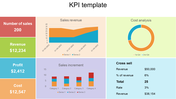
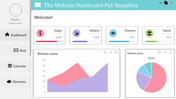
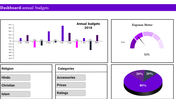
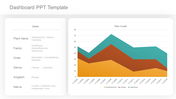
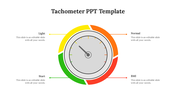
You May Also Like These PowerPoint Templates
Add to Wishlist
Download
AI Customize


Add to Wishlist
Download
AI Customize

Add to Wishlist
Download
AI Customize

Add to Wishlist
Download
AI Customize

Add to Wishlist
Download
AI Customize

Add to Wishlist
Download
AI Customize

Add to Wishlist
Download
AI Customize

Add to Wishlist
Download
AI Customize

Add to Wishlist
Download
AI Customize

Add to Wishlist
Download
AI Customize

Add to Wishlist
Download
AI Customize

Add to Wishlist
Download
AI Customize

Add to Wishlist
Download
AI Customize

Add to Wishlist
Download
AI Customize

Add to Wishlist
Download
AI Customize

Add to Wishlist
Download
AI Customize

Add to Wishlist
Download
AI Customize

Add to Wishlist
Download
AI Customize

Add to Wishlist
Download
AI Customize
