Dynamic Dashboard PPT Template for Strategic Planning

Dashboard layout with charts in orange tones, including a donut chart, bar graphs, and a line chart for monthly data.
P.ID : 17305
    229 views
    7 Downloads
    Get Custom Slides by Experts
    Instantly Access Templates in PowerPoint

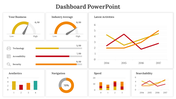
    Introducing the Orange Theme Dashboard PowerPoint Template


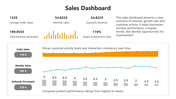
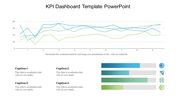
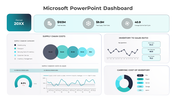
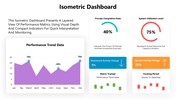
    Dashboards play a crucial role in visualizing and analyzing data effectively. Our Orange Theme Dashboard PowerPoint template is designed to cater to the diverse needs of professionals, educators, and project managers who aim to communicate complex data and insights with clarity and impact.

    About the Slide

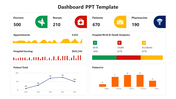
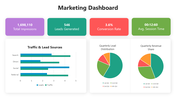
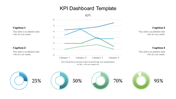
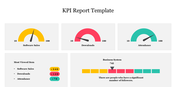
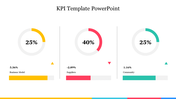
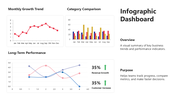
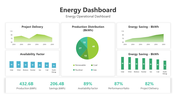
    The Dashboard PPT template offers a vibrant color tone with bar and circle charts for creating awesome presentations. It allows presenters to customize content easily, ensuring flexibility and consistency in design.

    Benefits of the Slide

    This template enhances audience engagement through its dynamic visual appeal and facilitates clearer communication of key messages. This 100% editable slide empowers users to tailor data to specific requirements, saving time and maintaining professionalism.

    Who Can Use

    Ideal for professionals across various industries, educators, and project managers looking to streamline data visualization and deliver impactful presentations that drive better decision-making.

    Get It Now!

    Features of the template:


    • 100% customizable slides and easy to download.
    • The slides contain 16:9 and 4:3 formats.
    • Easy to change the colors quickly.
    • It is a 100% pre-designed slide.
    Advertisement

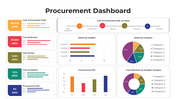
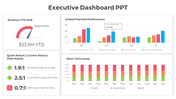
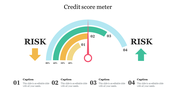
    You May Also Like These PowerPoint Templates

    Add to Wishlist
    Download
    AI Customize
    Executive dashboard slide displaying colorful charts for executing dashboard to quality.
    Add to Wishlist
    Download
    AI Customize
    Business dashboard featuring a profile card, three financial metrics, a 67% circular chart, and a dual-colored area graph.
    Add to Wishlist
    Download
    AI Customize
    KPI PPT slide featuring circular progress indicators and a table of data values with captions on a white backdrop.
    Add to Wishlist
    Download
    AI Customize
    Dashboard summary featuring progress visualizations, names, task status updates, and rewards marked with gold stars.
    Add to Wishlist
    Download
    AI Customize
    Sales KPI PPT slide featuring charts for Revenue, Revenue Comparison, New Customers, and Customer Acquisition Cost CAS.
    Add to Wishlist
    Download
    AI Customize
    A colorful dashboard PowerPoint slide featuring graphs, stats, and a pie chart for a data driven presentation with captions.
    Add to Wishlist
    Download
    AI Customize
    Dashboard PowerPoint slide featuring three speedometer style gauges displaying percentages with a dartboard graphic.
    Add to Wishlist
    Download
    AI Customize
    Dashboard with charts and metrics, including pie chart for sales, bar and line charts, and visitor statistics.
    Add to Wishlist
    Download
    AI Customize
    Dashboard slide displaying upcoming deposits, transactions, market location, and financial data on a dark backdrop.
    Free
    Add to Wishlist
    Download
    AI Customize
    Dashboard slide with a world map highlighting countries, a bar chart showing statistics, and two percentage indicators.
    Add to Wishlist
    Download
    AI Customize
    Executive dashboard PowerPoint slide featuring line and bar charts, pie charts, and world map markers for data analysis.
    Free
    Add to Wishlist
    Download
    AI Customize
    Five-level bar chart executive dashboard with colored blocks labeled with five levels, showing a gradual progression.
    Add to Wishlist
    Download
    AI Customize
    Dashboard themed PowerPoint slide with six gauges and captions for content.
    Add to Wishlist
    Download
    AI Customize
    Infographic template with bar, pie, and world map charts for PowerPoint presentations in shades of red and orange.
    Add to Wishlist
    Download
    AI Customize
    KPI slide displaying a financial table for FY 2018, with figures for Net Sales, Income, and Expenses for each quarter.
    Free
    Add to Wishlist
    Download
    AI Customize
    Free KPI PPT Template For Presentation & Google Slides
    Add to Wishlist
    Download
    AI Customize
    Key Performance Indicators (KPI) scorecard template displaying various objectives in colored sections each with text area.
    Free
    Add to Wishlist
    Download
    AI Customize
    KPI PPT Template with three colourful circular progress charts  showing percentages, growth indicators, and  bar charts.
    Add to Wishlist
    Download
    AI Customize
    KPI dashboard slide showing multiple charts, including bar, line, pie, and gauge charts with tracking business data.