Free - Our Predesigned KPI PowerPoint And Google Slides Template

Free
KPI slide displaying key performance indicators with many sections and accompanying data charts.
P.ID : 46889
    11 slides
    Slide deck of energy dashboards displaying data visualizations like pie charts, bar and line graphs, in green shades.
    36 slides
    KPI infographic slide deck, combining line and bar graphs,  pie charts, and performance dials for data representation.
    36 slides
    A collection of isometric KPI infographic slides showcasing bar graphs, pie charts, and performance metrics with icons.
    2.2K+ views
    946 Downloads
    Get Custom Slides by Experts
    Instantly Access Templates in PowerPoint

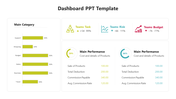
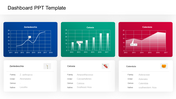
    Creative KPI PowerPoint Template


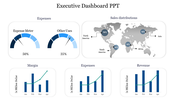
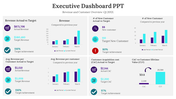
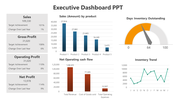
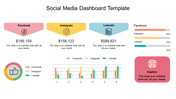
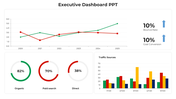
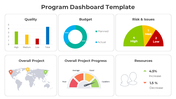
    A KPI is a measurable value that is important for assessing how effectively an organization is achieving its key business objectives. It provides insights into performance, progress and areas for improvement, designed to reflect strategic goals and priorities. Regular monitoring of KPIs enables informed decision-making, trend identification and corrective actions for long-term success. Professionals in business, project management, sales, marketing, and performance evaluation can benefit from the customizable templates in this slide deck, which include visually appealing designs, charts, and graphs. The template facilitates clear and compelling presentations of KPI dashboards, performance reports or strategic plans, aligning with specific content requirements and presentation styles. With fully editable slides, users can save time creating professional-quality presentations, effectively conveying insights about KPIs. Encourage audience use of this template to track, analyze and optimize key performance indicators for improved business performance and success.

    Features of this template


    • 100% customizable slides and easy to download.
    • The slide contains 16:9 and 4:3 formats.
    • Easy to change the colors of the slide quickly.
    • Highly compatible with PowerPoint and Google Slides.
    • Well-crafted template with an instant download facility.
    • Quick and easy edit features. 
    Advertisement

    You May Also Like These PowerPoint Templates

    Add to Wishlist
    Download
    AI Customize
    PowerPoint speedometer template featuring three speed gauges.
    Add to Wishlist
    Download
    AI Customize
    Circular tachometer divided into four sections  in blue, red, purple, and teal, featuring transport icons and captions.
    Add to Wishlist
    Download
    AI Customize
    Dashboard PowerPoint template featuring three speedometer graphics labeled with captions.
    Add to Wishlist
    Download
    AI Customize
    Attractive Tachometer Presentation Template Designs
    Add to Wishlist
    Download
    AI Customize
    Attractive Tachometer PowerPoint Presentation Template
    Add to Wishlist
    Download
    AI Customize
    PowerPoint dashboard template displaying Employee Net Promoter Score with a gauge and two emojis.
    Add to Wishlist
    Download
    AI Customize
    Vector illustration of a speedometer with colored section on a conveyor belt with placeholder text.
    Add to Wishlist
    Download
    AI Customize
    Dashboard PPT slide with three colorful speedometers representing varying performance levels on a black background.
    Add to Wishlist
    Download
    AI Customize
    Three circular tachometer dials in blue, pink, and red, each displaying different percentage values with captions below.
    Add to Wishlist
    Download
    AI Customize
    Slide with two speedometer style gauge charts in green, red, and purple segments, displaying percentages.
    Add to Wishlist
    Download
    AI Customize
    Dashboard template with a world map showing highlighted regions, bar graphs, and financial data captions.
    Add to Wishlist
    Download
    AI Customize
    Three colored tachometer gauges in red, orange, and green, each paired with a caption areas beneath.
    Add to Wishlist
    Download
    AI Customize
    Yellow speedometer design with two semicircular gauges displaying percentages, each paired with captions.
    Add to Wishlist
    Download
    AI Customize
    Tachometer PowerPoint template with four stages featuring colorful gauges and caption areas on a white backdrop.
    Add to Wishlist
    Download
    AI Customize
    Dashboard slide showcasing a semi circular layout with five numbered segments in blue, red, and green, each with captions.
    Add to Wishlist
    Download
    AI Customize
    Project dashboard template with four speedometer charts representing different completion levels with placeholder text.
    Add to Wishlist
    Download
    AI Customize
    Infographic featuring two red semicircular speedometers with needles, displaying percentages, and captions below.