Inventive Executive Dashboard PPT Template And Google Slides

Executive financial dashboard with revenue meter, global performance metrics, ratio targets, and asset data in a bar chart.
P.ID : 4010
    1.8K+ views
    626 Downloads
    Get Custom Slides by Experts
    Instantly Access Templates in PowerPoint

    Executive Dashboard PowerPoint Template


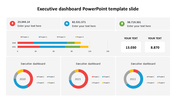
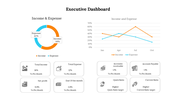
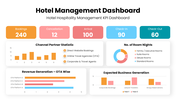
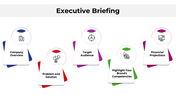
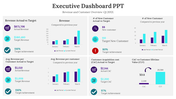
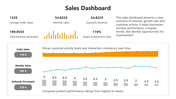
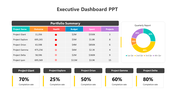
    The Executive Dashboard offers high-level insights for decision-makers, presenting key performance indicators (KPIs) and metrics crucial for strategic planning. Executives, senior management, and stakeholders use this tool to track organizational performance, identify trends, and make informed decisions efficiently. With customizable widgets and interactive features, the executive dashboard PPT template provides a concise overview of critical data, enabling swift actions to address challenges and capitalize on opportunities. Designed for simplicity and clarity, the Executive Dashboard streamlines information presentation, facilitating quick comprehension and strategic alignment across the organization.


    Features of the template


    • 100% customizable slides and easy to download.
    • The slide contains 16:9 and 4:3 formats.
    • Easy to change the colors of the slide quickly.
    • Highly compatible with PowerPoint and Google Slides.
    Advertisement

    You May Also Like These PowerPoint Templates

    Add to Wishlist
    Download
    AI Customize
    PowerPoint slide with a tachometer graphic showing numbers 1 through 8 in different colors, with placeholders for captions.
    Add to Wishlist
    Download
    AI Customize
    Colorful tachometer PowerPoint slide design with transportation icons including airplane, car, bus, and train with captions.
    Add to Wishlist
    Download
    AI Customize
    Ten speedometer icons in two rows, each with blue, green, and red segments, ranging from 0 to 100.
    Free
    Add to Wishlist
    Download
    AI Customize
    Six charts in different formats, including line, pie, bar, and gauge, all in blue and gray, displaying data trends.
    Add to Wishlist
    Download
    AI Customize
    Project management dashboard slide showing colored charts for net worth, sector allocation, and various financial metrics.
    Add to Wishlist
    Download
    AI Customize
    Tachometer slide with four gauges in orange, red, blue, and green, each with captions below describing different readings.
    Add to Wishlist
    Download
    AI Customize
    Dashboard with bar charts, line graphs, and a gauge chart in various colors and a percentage indicator, on white background.
    Add to Wishlist
    Download
    AI Customize
    Dashboard template with three fuel gauge icons, each showing different fuel levels with placeholder text.
    Add to Wishlist
    Download
    AI Customize
    Project management dashboard slide with visually colored charts and graphs displaying task status with icons.
    Add to Wishlist
    Download
    AI Customize
    Visual KPI layout with performance bar chart, doughnut chart, and percentage indicators for project analysis.
    Add to Wishlist
    Download
    AI Customize
    Dashboard PowerPoint Template and Google Slides
    Add to Wishlist
    Download
    AI Customize
    KPI dashboard layout with a yellow header, two gauge in teal and green, bar metrics, and pie charts on a light background.
    Add to Wishlist
    Download
    AI Customize
    Row of four colored speedometer-style gauges, each showing varying percentages with needle, and captions at the bottom.
    Add to Wishlist
    Download
    AI Customize
    Seven rectangular sections with financial data on top and visual charts below, bordered in blue with organized text.
    Add to Wishlist
    Download
    AI Customize
    Speedometer graphic with six sections from green to red color gradient, each with icons and text areas.
    Add to Wishlist
    Download
    AI Customize
    Semi circular meter template with green, lime, yellow, and red sections, each displaying thumbs up icons, and text.
    Free
    Add to Wishlist
    Download
    AI Customize
    KPI dashboard with a data table on the left and a circular chart on the right, featuring shades of teal and white.