Dashboard Examples PowerPoint Templates and Google Slides

Executive summary dashboard featuring contract metrics, costs vs. revenue, and breakdowns by status, industry, and category.
P.ID : 61218
    4.2K+ views
    479 Downloads
    Get Custom Slides by Experts
    Instantly Access Templates in PowerPoint

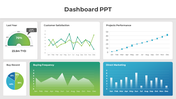
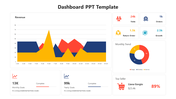
    Executive Summary Dashboard Presentation Slide


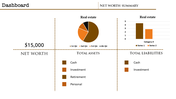
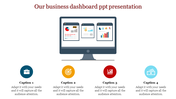
    Get a comprehensive view of your business health with our executive summary dashboard slide. This template provides a quick snapshot of essential metrics and performance indicators, visually summarizing a company's overall performance for easy reference.

    Who Can Use It?


    This dashboard is ideal for business executives and decision-makers seeking an efficient way to monitor business health and make informed decisions with real-time data insights.

    About the Slide


    Our executive summary dashboard template is customizable, with real-time updates to ensure relevancy. It's a powerful tool for businesses of all sizes, aiding in streamlined decision-making and performance tracking.

    Give it a try!

    Features of the template


    • 100% customizable slides and easy to download.
    • Slides are available in different nodes & colors.
    • The slide contains 16:9 and 4:3 formats.
    • Easy to change the colors of the slide quickly.
    • Well-crafted template with an instant download facility.
    • Highly compatible with PowerPoint and Google Slides.
    • It has an editable dashboard.
    • Perfectly designed slide.
    Advertisement

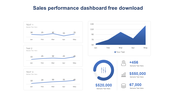
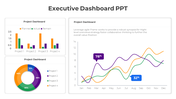
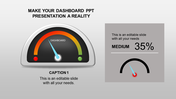
    You May Also Like These PowerPoint Templates

    Add to Wishlist
    Download
    AI Customize
    PPT template featuring a marketing dashboard with a colorful pie chart, bar graph, and progress bars for data presentation.
    Add to Wishlist
    Download
    AI Customize
    Circular gauge template with sections in red, orange, yellow, green, and dark green, with captions on either side.
    Add to Wishlist
    Download
    AI Customize
    Infographic dashboard featuring a world map with COVID-19 case data, a gender-based death rate chart, and a pie chart.
    Free
    Add to Wishlist
    Download
    AI Customize
    Executive dashboard slide with five numbered circular icons on dark blue shapes, each labeled with key principles.
    Add to Wishlist
    Download
    AI Customize
    KPI dashboard template PowerPoint slide featuring three sections for data visualization.
    Add to Wishlist
    Download
    AI Customize
    Dashboard layout including a bar chart of company data, a pie chart for quarterly sales distribution.
    Add to Wishlist
    Download
    AI Customize
    Dashboard gauges with red, yellow, green indicators showing low, medium, high performance against a gray background.
    Free
    Add to Wishlist
    Download
    AI Customize
    Pie chart in orange, red, green, and blue sections with two text labels on either side, highlighting sales performance.
    Add to Wishlist
    Download
    AI Customize
    Dashboard gauge chart PPT template with color coded sections for big loss, loss, break even, profit, and high profit.
    Free
    Add to Wishlist
    Download
    AI Customize
    Red-themed circular gauge divided into five sections from direction to business, with a central needle indicator.
    Free
    Add to Wishlist
    Download
    AI Customize
    Green radial gauge with a modern layout, surrounded by five labeled rectangular sections on a neutral background.
    Free
    Add to Wishlist
    Download
    AI Customize
    PowerPoint slide with a project dashboard showing two speedometers to represent project progress with captions.
    Add to Wishlist
    Download
    AI Customize
    Orange speedometer slide with a gauge showing 70% progress and space for caption text below.
    Free
    Add to Wishlist
    Download
    AI Customize
    Tachometer PowerPoint slide featuring a colorful gauge with segments labeled with space for captions on a white backdrop.
    Add to Wishlist
    Download
    AI Customize
    Executive dashboard slide displaying colorful charts for executing dashboard to quality.
    Free
    Add to Wishlist
    Download
    AI Customize
    Dashboard slide with a world map highlighting countries, a bar chart showing statistics, and two percentage indicators.
    Free
    Add to Wishlist
    Download
    AI Customize
    Five-level bar chart executive dashboard with colored blocks labeled with five levels, showing a gradual progression.