executive dashboard powerpoint template slide for company

Executive dashboard slide featuring bar graphs and pie charts comparing project data over three years, with text boxes.
P.ID : 51470
    853 views
    115 Downloads
    Get Custom Slides by Experts
    Instantly Access Templates in PowerPoint

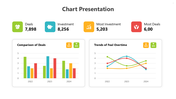
    Executive Dashboard PowerPoint Template Slide For Company

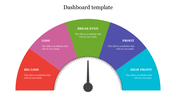
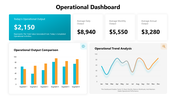
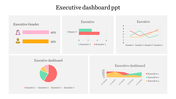
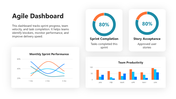
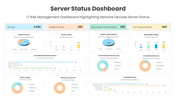
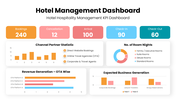
    This is an executive dashboard PowerPoint template slide. This executive template will help reveal revenue, cost, trends, cash flow diagrams, and other types of financial information. It can also be helpful for finance and sales-related icons for designing your slides. Utilize the given dashboard sample slides for revealing sales data, trends, information about an organization’s financial health, quarterly performance, and the like. 


    About the template

    Download this metrics dashboard. PowerPoint template layouts are beneficial for displaying analytics, trends, target market, and maps. This single slide template might help discuss demographics, market segments, product outreach, financial forecasts, etc. SlideEgg makes your presentation work simple and easy for any official and personal conference. Choose this multicolor template and scour your eminence to shine well among your technology partners.


    Features of the Template:

      • Innovative slide background designs
      • 100% easy to edit and customize slides
      • The slide contained 16:9 and 4:3 formats.
      • Easy to change the slide colors quickly.
      • The elegant look of this template will give life to your presentation.
      • Crisp and clear font styles.
      • Awesome dashboard PPT Slide.
      Advertisement

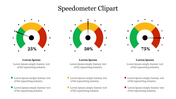
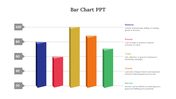
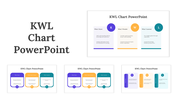
      You May Also Like These PowerPoint Templates

      Add to Wishlist
      Download
      AI Customize
      Credit score meter with a needle in the center, displaying risk levels on a gradient from yellow to blue with caption areas.
      Free
      Add to Wishlist
      Download
      AI Customize
      Two speedometers with red and purple needle pointers, with caption and corresponding colored dots below.
      Add to Wishlist
      Download
      AI Customize
      Dashboard template displaying a project timeline with a Gantt chart, project details, and phases from initiation to closure.
      Add to Wishlist
      Download
      AI Customize
      Sentiment meter infographic displaying six emotions in a colorful fan design, each labeled with placeholders text areas.
      Add to Wishlist
      Download
      AI Customize
      KPI Dashboard PowerPoint template displaying key metrics, including count of contracts, revenues, and costs.
      Add to Wishlist
      Download
      AI Customize
      Tachometer template with percentage markers and color-coded designs, each paired with caption areas.
      Add to Wishlist
      Download
      AI Customize
      Executive dashboard template showcasing growth, progress, and performance metrics for effective management.
      Add to Wishlist
      Download
      AI Customize
      Dashboard slide with two green gauge meters, each labeled with a caption and text below.
      Add to Wishlist
      Download
      AI Customize
      Microsoft dashboard slide showcasing supply chain costs, inventory to sales ratio, and carrying cost of inventory.
      Add to Wishlist
      Download
      AI Customize
      PowerPoint slide featuring a project dashboard with bar charts and a pie chart displaying project data and progress.
      Add to Wishlist
      Download
      AI Customize
      Project status dashboard slide displaying budgets and performance metrics for banners, social media, and brochures.
      Add to Wishlist
      Download
      AI Customize
      PowerPoint slide with a tachometer graphic showing numbers 1 through 8 in different colors, with placeholders for captions.
      Add to Wishlist
      Download
      AI Customize
      Colorful tachometer PowerPoint slide design with transportation icons including airplane, car, bus, and train with captions.
      Add to Wishlist
      Download
      AI Customize
      Ten speedometer icons in two rows, each with blue, green, and red segments, ranging from 0 to 100.
      Add to Wishlist
      Download
      AI Customize
      Tachometer slide with four gauges in orange, red, blue, and green, each with captions below describing different readings.
      Add to Wishlist
      Download
      AI Customize
      Dashboard with bar charts, line graphs, and a gauge chart in various colors and a percentage indicator, on white background.
      Add to Wishlist
      Download
      AI Customize
      Dashboard template with three fuel gauge icons, each showing different fuel levels with placeholder text.