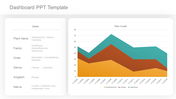
Creative Dashboard PowerPoint And Google Slides Template

Dashboard slide showing business performance, including technology, accessibility, and security scores with activity graphs.
P.ID : 7943
    2K+ views
    236 Downloads
    Get Custom Slides by Experts
    Instantly Access Templates in PowerPoint

    Admirable Dashboard Template PowerPoint Presentation

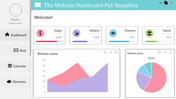
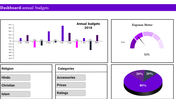
    Explore this alluring Creative Dashboard PowerPoint Slides Template to make a powerful presentation. This colorful template is so simple to edit and customize. Then, create a fantastic PowerPoint Presentation to attract the audience to the slides that you show them.

    About the Template:

    Are you looking for an excellent slide? Then this is the best Dashboard PowerPoint Slide. It saves you from the endless frustration of having to go through endless PowerPoint slides to get the information you need. Instead, you can get your new message right in front of you without having to go back to your computer. This is a fantastic way to save time, and it is easy to get started by typing some code into your Dashboard Slide!

    Features of the Template:

    • 100% customizable slides and easy to download.
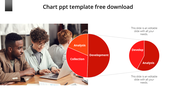
    • Slides are available in different nodes & colors.
    • The slide contained in 4:3 and 16:9 format.
    • Easy to change the slide colors quickly.
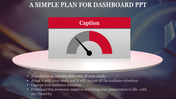
    • Eye-grabbing design slide for the presentation.
    • The excellent visuals of this slide will make your presentation eye-catching.
    Advertisement

    You May Also Like These PowerPoint Templates

    Add to Wishlist
    Download
    AI Customize
    Five segment pie chart in orange, blue, red, green, and pink, each with number and connected with text areas.
    Free
    Add to Wishlist
    Download
    AI Customize
    Line chart in teal showing data points from 2013 to 2020 on a white background, with five icons listed on the right.
    Free
    Add to Wishlist
    Download
    AI Customize
    Histogram on the left and Pareto chart in pink and orange with cumulative line on the right.
    Add to Wishlist
    Download
    AI Customize
    Project dashboard slides with Gantt chart, a burndown chart, and a timeline, using a palette of brown, green, and red.
    Free
    Add to Wishlist
    Download
    AI Customize
    Four blue pyramid shapes in ascending size, labeled with percentages, aligned over a horizontal gray bar.
    Add to Wishlist
    Download
    AI Customize
    Tachometer PowerPoint slide with gauges indicating 10, 20, and 30 with captions for each.
    Free
    Add to Wishlist
    Download
    AI Customize
    Dashboard with a timeline bar chart in green and purple, labeled with milestones for savings and investments.
    Add to Wishlist
    Download
    AI Customize
    A pie chart featuring five segments, each labeled with percentages, surrounded by text on a blue background.
    Add to Wishlist
    Download
    AI Customize
    Dashboard showing from defect rate trends upto delivery time analysis in mixed orange and brown theme.
    Add to Wishlist
    Download
    AI Customize
    KPI slide with four semi circular gauges displaying metrics and overlapping colored circles showing numerical data.
    Add to Wishlist
    Download
    AI Customize
    Slide with two donut charts displaying values and a text section on the right with a blurred background image.
    Add to Wishlist
    Download
    AI Customize
    Stacked column chart template displaying proportional data distribution across four categories using three series.
    Add to Wishlist
    Download
    AI Customize
    Colorful circular diagram slide illustrating four corporate strategy methods with labels and percentages.
    Add to Wishlist
    Download
    AI Customize
    KWL chart with sections  in blue, green, and red, each column containing placeholder text.
    Add to Wishlist
    Download
    AI Customize
    Dark themed layout featuring four pie charts with shaded segments, each displaying different percentages.
    Add to Wishlist
    Download
    AI Customize
    Dashboard with four bar charts in yellow, green, teal, and red, comparing project risks and change requests.
    Add to Wishlist
    Download
    AI Customize
    Slide with pie charts, line graphs, and a bar chart in shades of green, illustrating data trends and comparisons.
    Free
    Add to Wishlist
    Download
    AI Customize
    Infographic of a bar chart representing yearly growth from 2018 to 2021 with a businesswoman illustration.
    Add to Wishlist
    Download
    AI Customize
    Circular pie chart divided into five colored sections noted with percentages, with corresponding boxes for text area.