MILESTONE 🌟 5 Million+ creative minds trust SlideEgg! Grab 80% OFF

Tachometer Presentation Download PPT and Google Slides

Tachometer PowerPoint slide with gauges indicating 10, 20, and 30 with captions for each.
P.ID : 48941
    379 views
    52 Downloads
    Get Custom Slides by Experts
    Instantly Access Templates in PowerPoint

    Best Tachometer Presentation Template For PPT Slide 


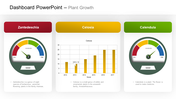
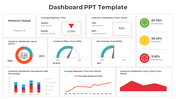
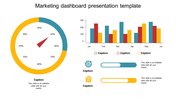
    Download this tachometer presentation template for some extraordinary analysis ppt templates. This tachometer presentation template will allow you to present the outcome of your analysis in a very effective manner. This type of template is highly customizable and easily editable, and so it will save your most valuable time and resources to a considerable extent.

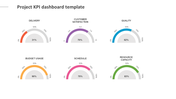
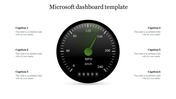
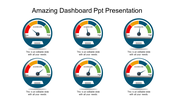
    This template has three exciting nodes that will describe the findings of your company and employees in a very different manner. Yes, the tachometer icon of each node will outshine the findings or the efficiency of each of them, so download this now. 

    Features of this template:

    • 100% customizable slides and easy to download. 
    • Slides available in different nodes and colors. 
    • The slide contained 16:9 and 4:3 format.
    • Easy to change the slide colors quickly. 
    • It is a well-crafted template with an instant download facility. 
    • Saves time.
    • Easy accessible and user-friendly. 
    Advertisement

    You May Also Like These PowerPoint Templates

    Add to Wishlist
    Download
    AI Customize
    Central black speedometer with four surrounding colored icons, each detailing various aspects of kilometers.
    Add to Wishlist
    Download
    AI Customize
    Awesome Dashboard PPT Template Free Download Slides
    Add to Wishlist
    Download
    AI Customize
    Template displaying a structured flowchart for KPI types, categorized into qualitative and quantitative evaluations.
    Add to Wishlist
    Download
    AI Customize
    Dashboard template showing a line chart of page likes over months with marked events in June and August.
    Add to Wishlist
    Download
    AI Customize
    Executive dashboard slide with a colorful line chart for yearly performance.
    Add to Wishlist
    Download
    AI Customize
    Dashboard Model PowerPoint slide showing statistics, graphs, and icons representing business data analysis.
    Add to Wishlist
    Download
    AI Customize
    KPI dashboard showcasing private school growth with yellow bar charts indicating critical, low, none, and high levels.
    Add to Wishlist
    Download
    AI Customize
    Dashboard slide with six gauge meters displaying low to high ranges, each labeled with captions below.
    Add to Wishlist
    Download
    AI Customize
    Circular tachometer design with a central gauge and surrounding colored segments, each linked to captions on the right.
    Add to Wishlist
    Download
    AI Customize
    Dashboard slide showing colour coded plant growth chart with progress ring visuals and percentages.
    Add to Wishlist
    Download
    AI Customize
    Dashboard slide showing sales bar chart with a highlighted value and a gauge representing business metrics.
    Add to Wishlist
    Download
    AI Customize
    KPI dashboard layout with blue and green line graphs at the top and shaded bar charts at the bottom in gradient colors.
    Add to Wishlist
    Download
    AI Customize
    Financial dashboard with bar charts in pink and blue, colored circular pie charts, and teal boxes highlighting metrics.
    Add to Wishlist
    Download
    AI Customize
    Speedometer template with a needle pointing at 70%, featuring a section in a whote backdrop for a caption areas.
    Add to Wishlist
    Download
    AI Customize
    Speedometer template with four gauges displaying percentages: blue at 70%, orange at 50%, dark red at 55%, and red at 85%.