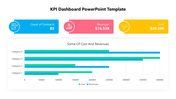
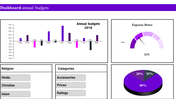
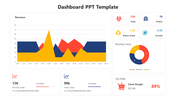
Multicolor Project KPI Dashboard Template Model

Six semicircular gauges with colored indicators in red, purple, blue, yellow, pink, and green on a white backdrop.
P.ID : 41700
    1.4K+ views
    221 Downloads
    Get Custom Slides by Experts
    Instantly Access Templates in PowerPoint

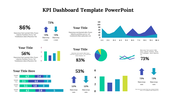
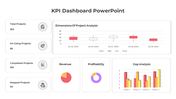
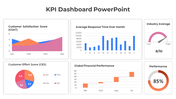
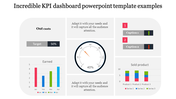
    Innovative KPI Dashboard PowerPoint Slide

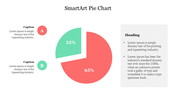
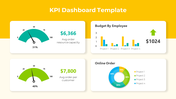
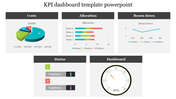
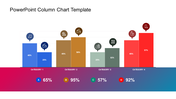
    Project managers and teams may track and see the performance of their projects with the aid of this project KPI dashboard template. It contains editable graphs, charts, and metrics for monitoring the progress of projects. The template also offers the option to add unique KPI definitions and alerts in addition to pre-built KPI definitions and alerts. The template is flexible and simple to modify, enabling users to change the colors, fonts, and visuals to fit the style and feel of their project. Google Slides and PPT both maintain consistency. You can download several business dashboard themes from Slide Egg as well. The template also provides capabilities for making reports and presentations and lets you exchange data with other programs. Just give it a shot!

    Features of this Template 

    • 100 % customizable slides and easy to download.
    • Slides are available in different colors.
    • The Slide has 4:3 and 16:9 formats.
    • Easy to change the slide colors quickly.
    • Appealing Presentation to impress an audience.
    • Create feature-rich slide presentations. 
    • An eye-pleasing color slide helps to give a catchy presentation.
    • Crisp and clear font styles and design Presentation.
    • Powerful KPI design Presentation.
    Advertisement

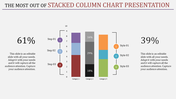
    You May Also Like These PowerPoint Templates

    Add to Wishlist
    Download
    AI Customize
    Slide featuring a dashboard with three dials labeled Low, Mid, and High, indicating various levels of measurement.
    Free
    Add to Wishlist
    Download
    AI Customize
    Circular speedometer with orange and gray segments, displaying kilometer markings from 5.5 KM to 8 KM.
    Free
    Add to Wishlist
    Download
    AI Customize
    Dashboard graphic featuring a circular speedometer with a red needle, surrounded by text labels for various business metrics.
    Add to Wishlist
    Download
    AI Customize
    Slide with pie charts, line graphs, and a bar chart in shades of green, illustrating data trends and comparisons.
    Add to Wishlist
    Download
    AI Customize
    Speedometer slide with three colorful gauges showing percentages each with captions.
    Add to Wishlist
    Download
    AI Customize
    Dashboard with a red line graph for Jan-May and a bar chart of four colored percentage bars and category icons.
    Free
    Add to Wishlist
    Download
    AI Customize
    PowerPoint slide showcasing projected cash flows, NPV for 3 and 5 years, and payback period with client testimonial.
    Free
    Add to Wishlist
    Download
    AI Customize
    Infographic of a bar chart representing yearly growth from 2018 to 2021 with a businesswoman illustration.
    Add to Wishlist
    Download
    AI Customize
    Circular pie chart divided into five colored sections noted with percentages, with corresponding boxes for text area.
    Add to Wishlist
    Download
    AI Customize
    Three panel dashboard with column, bar, and funnel charts at the top and numbered blue boxes with text below.
    Free
    Add to Wishlist
    Download
    AI Customize
    Dashboard with line chart for appointments, bar chart from hospital earnings to patient totals, and intake by category.
    Add to Wishlist
    Download
    AI Customize
    Slide deck of energy dashboards displaying data visualizations like pie charts, bar and line graphs, in green shades.
    Free
    Add to Wishlist
    Download
    AI Customize
    KPI dashboard layout with blue semicircle gauges and line charts representing social media performance metrics.
    Free
    Add to Wishlist
    Download
    AI Customize
    Dashboard layout with three semicircular gauges in orange and brown tones, paired with captions, on a beige background.
    Add to Wishlist
    Download
    AI Customize
    Project management dashboard with bar charts, numerical data panels, and color-coded sections.
    Add to Wishlist
    Download
    AI Customize
    Innovative KWL Chart PowerPoint Presentation Slide
    Add to Wishlist
    Download
    AI Customize
    Analysis report template featuring a purple and green area graph comparing five projects, with separate information
    Add to Wishlist
    Download
    AI Customize
    Area chart with overlapping blue, teal, and green sections, timeline on the axis, and three labeled boxes below.