Awesome KPI Dashboard PowerPoint And Google Slides

Dashboard slide with a pie chart, stacked area chart, and multiple colored rectangular boxes displaying metrics.
P.ID : 35537
    551 views
    48 Downloads
    Get Custom Slides by Experts
    Instantly Access Templates in PowerPoint

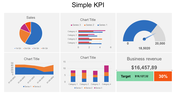
    KPI  Dashboard  PowerPoint Template


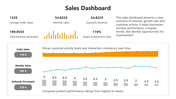
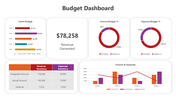
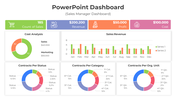
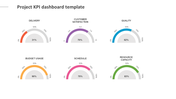
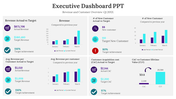
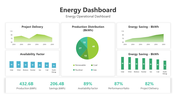
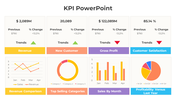
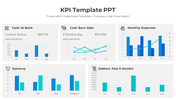
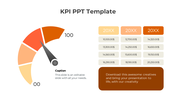
    A KPI dashboard serves as a visual tool for monitoring the health and progress of an organization, project, or initiative by displaying key metrics and performance indicators. It offers stakeholders a comprehensive snapshot of relevant data, enabling easy assessment of performance against predefined goals and objectives. Typically featuring charts, graphs, and visual elements, KPI dashboards facilitate informed decision-making and strategic planning by presenting complex data in a clear and accessible format. By tracking KPIs in real-time or periodically, organizations can identify trends, areas for improvement, and opportunities for optimization, leading to proactive management and continuous improvement initiatives. Professionals across various industries, including business management, project management, finance, and marketing, can benefit from customizable templates to create informative KPI dashboards that effectively communicate key performance metrics and trends. With fully editable slides, presenters can tailor the template to their specific content needs and presentation styles, saving time in creating professional-quality presentations and effectively conveying insights to their audience. Encourage users to utilize this template to track, analyze, and optimize their key performance indicators for enhanced business performance and success.

    Features of this template


    • 100% customizable slides and easy to download.
    • The slide contains 16:9 and 4:3 formats.
    • Easy to change the colors of the slide quickly.
    • Highly compatible with PowerPoint and Google Slides.
    • Well-crafted template with an instant download facility.
    • Quick and easy edit features.
    Advertisement

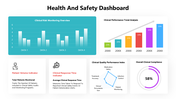
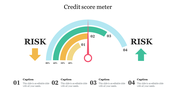
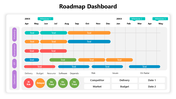
    You May Also Like These PowerPoint Templates

    Free
    Add to Wishlist
    Download
    AI Customize
    Four black speedometers with white numbers and yellow markers arranged in a two by two grid with descriptions.
    Add to Wishlist
    Download
    AI Customize
    KPI infographic slide deck, combining line and bar graphs,  pie charts, and performance dials for data representation.
    Add to Wishlist
    Download
    AI Customize
    Semi circular gauge in shades of brown and peach with a pointer, alongside text and a silhouette group at the bottom.
    Free
    Add to Wishlist
    Download
    AI Customize
    An executive dashboard showing income and expense distribution, with key financial metrics and a line graph.
    Add to Wishlist
    Download
    AI Customize
    Semi circular gauge with six color coded sections from green to red, With numbers 01 to 06, labeled KPI at the bottom.
    Add to Wishlist
    Download
    AI Customize
    A collection of isometric KPI infographic slides showcasing bar graphs, pie charts, and performance metrics with icons.
    Add to Wishlist
    Download
    AI Customize
    Slide with blue stats on the left and various charts, including bar and pie charts in different colors.
    Add to Wishlist
    Download
    AI Customize
    Comprehensive project dashboard template with progress charts, data bars, and financial performance indicators.
    Add to Wishlist
    Download
    AI Customize
    KPI dashboard featuring financial data with profit trends and metrics visualized through charts and dials.
    Free
    Add to Wishlist
    Download
    AI Customize
    Dashboard template with five numbered columns and placeholders text areas in different shades of grey theme.
    Add to Wishlist
    Download
    AI Customize
    KPI Dashboard slide displaying metrics with bar charts and line graphs for key business indicators.
    Add to Wishlist
    Download
    AI Customize
    PowerPoint speedometer template featuring three speed gauges.
    Add to Wishlist
    Download
    AI Customize
    Circular tachometer divided into four sections  in blue, red, purple, and teal, featuring transport icons and captions.
    Add to Wishlist
    Download
    AI Customize
    Dashboard PowerPoint template featuring three speedometer graphics labeled with captions.
    Add to Wishlist
    Download
    AI Customize
    Attractive Tachometer Presentation Template Designs