Amazing Dashboard PowerPoint Template And Google Slides

Amazing Dashboard PowerPoint Template And Google Slides
P.ID : 1854
    1.8K+ views
    433 Downloads
    Get Custom Slides by Experts
    Instantly Access Templates in PowerPoint

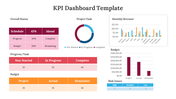
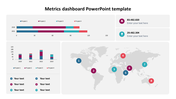
    Dashboard PowerPoint Templates


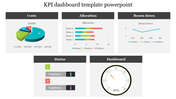
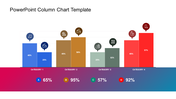
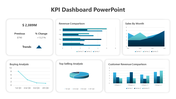
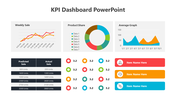
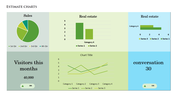
    Want to shine in a new way! Unleash the power of knowledge and transform your data into a visual masterpiece with our dynamic dashboard templates. Experience the ease of analyzing and reporting data as our templates simplify the process with their intuitive and visually captivating dashboards. Whether you're diving into business analytics, managing projects, or tracking social media metrics and finances, our templates have got you covered. Keep a pulse on key metrics, spot emerging trends, and unlock the wisdom needed for informed decision-making through interactive charts, graphs, and widgets. With customizable features and user-friendly interfaces, our templates make crafting dynamic dashboards a breeze. Empower your organization with actionable insights and chart a course for success using our extraordinary dashboard PowerPoint template.

    Features of this template


    • 100% customizable slides and easy to download.
    • Slides are available in different nodes & colors.
    • The slide contains 16:9 and 4:3 formats.
    • Easy to change the colors of the slides quickly.
    • Well-crafted template with an instant download facility.
    • Highly compatible with PowerPoint and Google Slides.
    • Dashboard design with text area.
    Advertisement

    You May Also Like These PowerPoint Templates

    Free
    Add to Wishlist
    Download
    AI Customize
    World map infographic surrounded by six segments with icons for business-related captions and caption areas.
    Free
    Add to Wishlist
    Download
    AI Customize
    Pyramid infographic with four golden pyramids in ascending order, marked with percentages 10% to 40% on a dark base.
    Add to Wishlist
    Download
    AI Customize
    Slide featuring a financial report with bar charts and a table, showing website and a percentage statistic on the right.
    Free
    Add to Wishlist
    Download
    AI Customize
    Horizontal bar chart with green and gray bars of varying lengths, labeled with placeholder text, on a light background.
    Add to Wishlist
    Download
    AI Customize
    Four pencil-shaped bars for education in orange, blue, red, and green representing data from 2011 to 2014 with values.
    Free
    Add to Wishlist
    Download
    AI Customize
    Pie chart PPT slide with four sections in different colors and percentages, with accompanying text labels for each section.
    Add to Wishlist
    Download
    AI Customize
    Pie Chart PPT Presentation Template for Data Analysis
    Free
    Add to Wishlist
    Download
    AI Customize
    Bar chart with five purple cylinders and percentages arranged from left to right, next to a professional woman in a suit.
    Free
    Add to Wishlist
    Download
    AI Customize
    Bar chart with four vertical colored columns in green, blue, yellow, and red, with gray tops and captions above.
    Add to Wishlist
    Download
    AI Customize
    Bar chart in PowerPoint displaying data with titles and placeholders for example text and additional information.
    Add to Wishlist
    Download
    AI Customize
    Chart slide showing monthly bar graphs split into two sections and pie charts highlighting four color-coded items.
    Add to Wishlist
    Download
    AI Customize
    Four vertical 3D bars with percentages in red, pink, blue, and purple shades, aligned with captions.
    Add to Wishlist
    Download
    AI Customize
    Timeline chart slide displaying key dates and durations from July 2018 to October 2021 with placeholder text.
    Add to Wishlist
    Download
    AI Customize
    PowerPoint Chart Template And Google Slides-Three Node
    Free
    Add to Wishlist
    Download
    AI Customize
    Four cylindrical blue bars in a row next to a woman in a black suit in a simple design layout.
    Free
    Add to Wishlist
    Download
    AI Customize
    Green bar chart PowerPoint slide with percentages for the years 2017 through 2021 and a woman standing next to the chart.
    Add to Wishlist
    Download
    AI Customize
    Green circular chart with five segments labeled by categories and percentages, with descriptions around it.