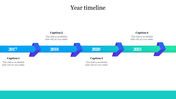
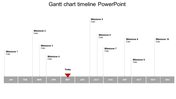
Our Predesigned Timeline Chart In PowerPoint Slide

Colorful timeline PowerPoint chart illustrating shifts for various employees throughout the day with peak hours highlighted.
P.ID : 41143
    934 views
    103 Downloads
    Get Custom Slides by Experts
    Instantly Access Templates in PowerPoint

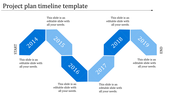
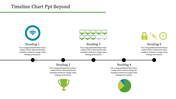
    Multicolored Timeline PowerPoint Template

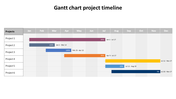
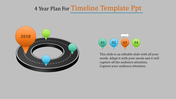
    Take a look at the schedule and estimate how long each task should take. While you're at it, decide on significant dates or milestones that signal the conclusion of one project phase and the start of the next. With the use of a strong instrument and a great slide, you can achieve it. Create your PPT presentation using this fantastic chart from our gallery. It is built with horizontal bars and margin models on a white background. Changes can be made to slide edges, line spacing, and graphic components like images or brand designs. Take a chance and succeed with it! Let your audience dance to the tune of your timeline talk!

    Features of the template

    • 100 % customizable slides and easy to download.
    • Slides are available in different colors
    • The slide has 4:3 and 16:9 formats.
    • Easy to change the slide colors quickly.
    • Appealing presentation to impress an audience.
    • Create feature-rich slide presentations. 
    • An eye-pleasing color slide helps to give a catchy presentation.
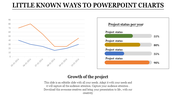
    • Best timeline chart design.
    Advertisement

    You May Also Like These PowerPoint Templates

    Add to Wishlist
    Download
    AI Customize
    Innovative Cockpit Charts PowerPoint Download PPT Slides
    Add to Wishlist
    Download
    AI Customize
    A line chart  slide showing data trends across seven items with two percentage indicators with icons and caption areas.
    Add to Wishlist
    Download
    AI Customize
    Bar chart slide showing data trends from 2016 to 2021 with three categories, highlighted in red, teal, and yellow bars.
    Add to Wishlist
    Download
    AI Customize
    Circular progress bar with four colorful concentric rings and percentage labels, surrounded by text areas.
    Free
    Add to Wishlist
    Download
    AI Customize
    Color-coded Gantt chart template for project management, displaying four phases across quarters with colorful text boxes.
    Add to Wishlist
    Download
    AI Customize
    Three outlined boxes in yellow, red, and green, each with circles labeled K, W, and L, at the bottom.
    Add to Wishlist
    Download
    AI Customize
    KPI dashboard template with six sections which includes charts, graphs, and numerical data.
    Add to Wishlist
    Download
    AI Customize
    KPI Infographics PowerPoint And Google Slides Themes
    Add to Wishlist
    Download
    AI Customize
    A project management dashboard slide featuring a table of test case data alongside visual graphs and planned progress.
    Add to Wishlist
    Download
    AI Customize
    Two line graphs comparing data trends with different colors, featuring seven data points on each chart.
    Add to Wishlist
    Download
    AI Customize
    Colorful business analytics dashboard displaying bar graphs, line charts, and percentage indicators in a structured layout.
    Add to Wishlist
    Download
    AI Customize
    Stacked column chart with three categories, percentage labels, and circular step icons on both sides with percentage figures.
    Add to Wishlist
    Download
    AI Customize
    A stock chart with five vertical bars in orange and teal, representing financial data for a day period.
    Add to Wishlist
    Download
    AI Customize
    Line chart with labeled high and low points across a fluctuating path, illustrating peaks and troughs in data trends.
    Add to Wishlist
    Download
    AI Customize
    Dashboard layout with income, expenses, profit, and cash flow figures on the left, a project budget chart in the center.
    Add to Wishlist
    Download
    AI Customize
    Dashboard template with pink charts showing facebook and twitter activity, percentage rings, and a page growth graph.
    Add to Wishlist
    Download
    AI Customize
    Line chart template with two lines and labeled data points, along with caption blocks on the left.