Impressive Process Flow Chart Template Presentation

Process flow chart slide with a 3D pie representation and percentage distribution for each of the top four qualifiers.
P.ID : 3879
    664 views
    43 Downloads
    Get Custom Slides by Experts
    Instantly Access Templates in PowerPoint

    Process Flow Chart Presentation Slide


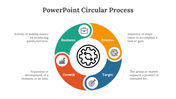
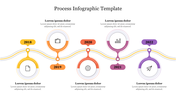
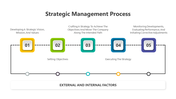
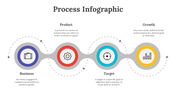
    Elevate presentations with our dynamic PowerPoint Process Flow Slides! Imagine a double-stage circle in calming blue, connected to a second circle displaying vibrant percentages. It's not just a slide; it's a visual masterpiece conveying complex processes with elegance.Tailored for professionals, students, and anyone seeking impactful templates, these slides are a game-changer. Effortlessly convey concepts with visually appealing design, fostering engagement and understanding.

    User-friendly and versatile, these templates cater to diverse needs, from business meetings to educational presentations. Leverage interconnected circles and percentage indicators to highlight metrics and milestones.  Whether you're a professional or student aiming for excellence, our PowerPoint Process Flow Slides are your secret weapon. Download now to unlock the potential of impactful communication! Your audience awaits; let the transformation begin! 

    Features of the template

    • 100% customizable slides and easy to download.
    • Slides are available in different colors
    • The slide has 4:3 and 16:9 formats.
    • Easy to change the slide colors quickly.
    • Appealing Presentation to impress an audience.
    • Create feature-rich slide presentations. 
    • An eye-pleasing color slide helps to give a catchy display.
    • Highly compatible with PowerPoint and Google Slides.
    Advertisement

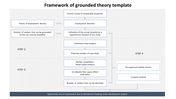
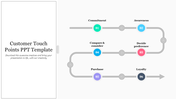
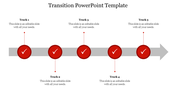
    You May Also Like These PowerPoint Templates

    Add to Wishlist
    Download
    AI Customize
    Illustration of the butterfly life cycle showing stages from caterpillar, to adult butterfly on a floral background.
    Add to Wishlist
    Download
    AI Customize
    Colorful pie chart with eight numbered sections representing business buying steps, with labels around it.
    Add to Wishlist
    Download
    AI Customize
    Effective Operations Management PPT  & Google Slides
    Add to Wishlist
    Download
    AI Customize
    Five interconnected circles with arrows showing from enterprise purpose up to management system each with a caption area.
    Add to Wishlist
    Download
    AI Customize
    Five colorful circles in purple, red, green, blue, and yellow, each with icons inside, connected by a gray curved arrow.
    Free
    Add to Wishlist
    Download
    AI Customize
    Free Operating Model For PowerPoint Presentation Slide
    Add to Wishlist
    Download
    AI Customize
    Diagram illustrating the supply chain optimization process, highlighting key stages.
    Add to Wishlist
    Download
    AI Customize
    Slide with blue to green gradient wave shaped infographic with five sections numbered 01 to 05, each with icon and text.
    Add to Wishlist
    Download
    AI Customize
    Flowchart with colorful icons, illustrating key stages of grounded theory research along a vertical arrow.
    Add to Wishlist
    Download
    AI Customize
    Customer types slide showing categories decision maker, economic buyer, recommender, influencer, and end user.
    Add to Wishlist
    Download
    AI Customize
    Vertical flow diagram with curved purple, red, and blue sections, each containing an icon and paired with text boxes.
    Free
    Add to Wishlist
    Download
    AI Customize
    Slide featuring four active sections with icons including scales of justice, a handshake, a book, and a gavel, with captions.
    Add to Wishlist
    Download
    AI Customize
    Five step value chart with red, orange, yellow, green, and teal boxes, depicting value and delay in each stage.
    Add to Wishlist
    Download
    AI Customize
    Triangle diagram with three labeled sections connected by arrows, representing stages of a habit loop.
    Add to Wishlist
    Download
    AI Customize
    Circular chart with eight segments, each labeled with different emotions, and caption areas arranged in a wheel pattern.
    Add to Wishlist
    Download
    AI Customize
    Four-step retail process illustration featuring icons for shop, receipt, price, and scale with a shopping cart graphic.
    Add to Wishlist
    Download
    AI Customize
    Horizontal infographic slide with five steps, represented by colored icons with captions and placeholder text.
    Add to Wishlist
    Download
    AI Customize
    A sequence of five diamond shaped icons with corresponding colored text boxes, forming a linear diagram.
    Add to Wishlist
    Download
    AI Customize
    Infographic of five colored connected circular steps in a horizontal line, displaying numbered steps with captions below.