Best Timeline Chart Template For Presentation Slide

Timeline chart template showing tasks across four years with segmented bars in yellow, red, and purple.
P.ID : 67538
    77 views
    5 Downloads
    Get Custom Slides by Experts
    Instantly Access Templates in PowerPoint

    Four Noded Timeline PowerPoint Template With Chart

    Rush to grab this eye-catching Timeline Chart Template to present the timeline in a chart format. It is an attractive, multicolor slide with a simple and organized layout. Using this slide, you can make a professional-looking timeline presentation. It also provides you the features to modify the background, nodes, font, color scheme, etc. Download Now!

    About the template

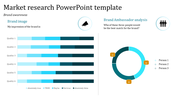
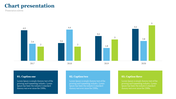
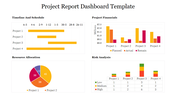
    The Timeline Chart Template is a creative four-noded slide. It has a  well-designed bar chart with vertical bars. The x-axis is named with the tasks, and the y-axis with years. Using this chart slide, you can also analyze the tasks. It allows you to customize the chart with your own values, and it is possible to modify the years and tasks. You can also try our Free Blank Timeline Template to make stunning personalized timeline presentations.

    Features of the template

    • 100% customizable slides and easy to download.
    • Slides are available in different nodes & colors.
    • The slide contained 16:9 and 4:3 formats.
    • Easy to change the slide colors quickly.
    • Well-crafted template with instant download facility.
    • It has a well-designed chart design.
    Advertisement

    You May Also Like These PowerPoint Templates

    Free
    Add to Wishlist
    Download
    AI Customize
    An annual sales template with sections labeled Heading 1 to 5 and a pie chart illustrating various percentages with text.
    Add to Wishlist
    Download
    AI Customize
    Infographic featuring pie graph, horizontal and vertical bar charts for visualizing data trends and comparisons.
    Free
    Add to Wishlist
    Download
    AI Customize
    Illustrative slide combining a pie chart with 45% in green and five silhouette icons to convey data distribution.
    Free
    Add to Wishlist
    Download
    AI Customize
    Vertical bar chart with three purple bars increasing from 2019 to 2021, each labeled with percentages, and a businesswoman.
    Add to Wishlist
    Download
    AI Customize
    Executive slide showing expense meters, world sales performance, and bar graphs for margin, expenses, and revenue by month.
    Add to Wishlist
    Download
    AI Customize
    KPI template displaying financial metrics, including sales, profitability, liquidity, and leverage, with two gauge charts.
    Add to Wishlist
    Download
    AI Customize
    Executive dashboard slide with a pie chart, bar graph, area chart, and a profile section for job title and details.
    Add to Wishlist
    Download
    AI Customize
    PowerPoint bar chart design slide featuring various colored flags and labeled categories at the bottom.
    Add to Wishlist
    Download
    AI Customize
    KPI template with three gauges displaying progress levels for sales, production, and downloads.
    Free
    Add to Wishlist
    Download
    AI Customize
    Business pie chart template with a car background, featuring sections labeled with text and pie chart values.
    Free
    Add to Wishlist
    Download
    AI Customize
    PowerPoint slide showing a line chart with data for 2018, 2019, 2020, and 2021, displaying percentages for each year.
    Add to Wishlist
    Download
    AI Customize
    Customized PowerPoint Charts Template Presentation
    Add to Wishlist
    Download
    AI Customize
    Colorful pie chart with six segments, each labeled with percentages and color-coded text on the right.
    Add to Wishlist
    Download
    AI Customize
    A dashboard PPT slide with bar charts for Zantedeschia, Celosia, and Calendula, and three colorful gauge indicators.
    Free
    Add to Wishlist
    Download
    AI Customize
    Weekly bar chart with green bars showing Style 1 to Style 4 timelines, accompanied by a tilted yellow note box.
    Add to Wishlist
    Download
    AI Customize
    Dashboard presentation slide with a line chart trend and circular charts highlighting project progress percentages.
    Add to Wishlist
    Download
    AI Customize
    Line graph displaying trends across four categories with three distinct colored lines and percentage highlights below.
    Add to Wishlist
    Download
    AI Customize
    Infographic charts for PowerPoint slide featuring bar, pie, and map charts in different styles and colors.
    Free
    Add to Wishlist
    Download
    AI Customize
    Five vertical purple bars in a row, each on a gray base, with a businesswoman figure on the right side.