Free - Chart Presentation Template for Data Visualization

Free
Chart slide with four interlinked circular diagrams, and two radar charts in blue and green at the bottom.
P.ID : 33841
    427 views
    63 Downloads
    Get Custom Slides by Experts
    Instantly Access Templates in PowerPoint

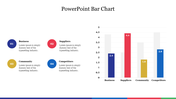
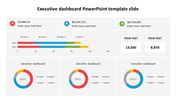
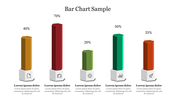
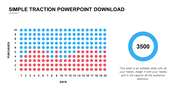
    Colorful Chart Presentation Template


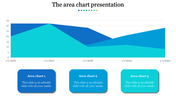
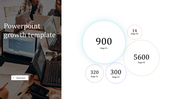
    Energize your presentation with this Free chart presentation template. It features four colorful circles and two pentagons, all color-coded for easy data visualization. Text areas allow you to clearly communicate insights from your charts. This template is perfect for anyone who wants to add a touch of creativity and visual interest to their presentations.

    This template is well-suited for a wide range of presenters, including teachers, marketers, business owners – you name it! This template is your secret weapon for presentations that resonate. Download this Free template today and let your data shine!

    Features of the template


    • 100% customizable slides and easy to download.
    • The slides contain 16:9 and 4:3 formats.
    • Easy to change the colors quickly.
    • It is a well-crafted template with an instant download facility.
    • It is a 100% pre-designed slide.
    • The slide holds vibrant colors.
    Advertisement

    You May Also Like These PowerPoint Templates

    Add to Wishlist
    Download
    AI Customize
    Color coded KWL chart template with sections for What I Know, What I Want to Know, and What I Learned with placeholder text.
    Add to Wishlist
    Download
    AI Customize
    A slide with a line chart slide showing data for Category 1 to 2 over several years with placeholder text.
    Add to Wishlist
    Download
    AI Customize
    Innovative Pie Chart Presentation Example Slide PPT
    Add to Wishlist
    Download
    AI Customize
    PowerPoint slide featuring four bar charts with different colors and captions, each representing different data percentages.
    Add to Wishlist
    Download
    AI Customize
    Scatter plot with differently sized bubbles in orange and purple, with a legend and product descriptions to the side.
    Add to Wishlist
    Download
    AI Customize
    Green color KWL chart presentation template with sections for What I Know, What I Want to Know, and What I Learned.
    Add to Wishlist
    Download
    AI Customize
    Yearly loss chart with six green bars and a line graph illustrating trends from 2014 to 2019.
    Add to Wishlist
    Download
    AI Customize
    Mekko chart displaying monthly data in sections, with colors indicating different categories from January to December.
    Add to Wishlist
    Download
    AI Customize
    KWL chart slide with three light gray boxes, featuring maroon headers and side labels for knowledge tracking.
    Add to Wishlist
    Download
    AI Customize
    KWL Chart Infographics PPT Template For Presentation
    Add to Wishlist
    Download
    AI Customize
    EDITABLE TRACTION POWERPOINT DESIGN TEMPLATES
    Free
    Add to Wishlist
    Download
    AI Customize
    Slide with a circular chart and two bars, highlighted in red, with progress indicator and explanatory text beside.
    Add to Wishlist
    Download
    AI Customize
    PowerPoint slide with multiple charts and graphs, including a line chart, bar chart, and area chart, each with captions.
    Add to Wishlist
    Download
    AI Customize
    PPT slide with a line chart illustrating trends for three series, using red, blue, and yellow lines with a caption.
    Add to Wishlist
    Download
    AI Customize
    Technology slide featuring a line graph with data points and percentages, set against a grayscale geometric pattern.
    Add to Wishlist
    Download
    AI Customize
    Editable PowerPoint Chart Templates For Presentation
    Add to Wishlist
    Download
    AI Customize
    Infographic with bar charts, percentage stats, and a layered blue 3D smartphone like structure with four captions.