Chart PowerPoint Presentation for Data Visualization

Elevate Your Presentations with Chart PPT Template
Looking to enhance your presentations with impactful visual aids? Our Chart Presentation Template and Google Slides Themes are to help you do just that.
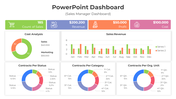
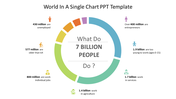
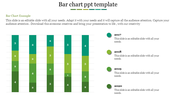
This template features a sleek chart with a caption and text area, set against a futuristic background. It's perfect for professionals, educators, analysts, and marketers who need to present data, trends, or insights.
Whether you're creating a sales report, a marketing analysis, or a financial presentation, our template provides the tools you need to convey your message effectively. With its modern design and easy-to-edit format, you can impress your audience and communicate your ideas.
Features of the template
- 100% customizable slides are easy to download.
- Slides are available in different colors.
- The slide has 4:3 and 16:9 formats.
- It is easy to change the slide colors quickly.
- It has a cute design to impress an audience.
- Create feature-rich, animated presentations.


You May Also Like These PowerPoint Templates
Add to Wishlist
Download
Edit


Add to Wishlist
Download
Edit

Add to Wishlist
Download
Edit


Add to Wishlist
Download
Edit


Add to Wishlist
Download
Edit

Add to Wishlist
Download
Edit


Add to Wishlist
Download
Edit

Add to Wishlist
Download
Edit


Add to Wishlist
Download
Edit

Add to Wishlist
Download
Edit

Add to Wishlist
Download
Edit

Add to Wishlist
Download
Edit

Add to Wishlist
Download
Edit

Add to Wishlist
Download
Edit

Add to Wishlist
Download
Edit
