Multicolor KPI Presentation Template PPT Slide Design

Row of four colored speedometer-style gauges, each showing varying percentages with needle, and captions at the bottom.
P.ID : 66130
    838 views
    124 Downloads
    Get Custom Slides by Experts
    Instantly Access Templates in PowerPoint

    Multinode Indicator KPI Template Presentation Slide

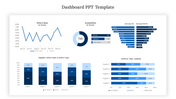
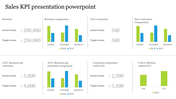
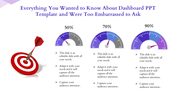
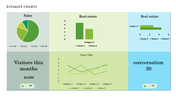
    The abbreviation for KPI is Key Performance Indicator. Acquire this key indicator Slide for the PPT presentation; it is about the value measurement that demonstrates how the company effectively achieves the business objectives. Try this creative KPI slide for a fantastic presentation.

    About the template 

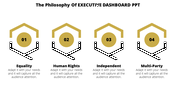
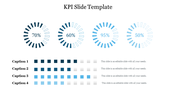
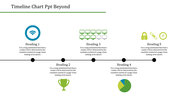
    Obtain this KPI presentation template PPT with a bright white background that helps to give an attractive look to the template with images and texts. The template has the animated indicator images in different colors in circle shape indicating various points. And the template has four captions with editable texts for you to alter and add more points. You get an opportunity to modify the changes in the template with the colorful features provided by SlideEgg. Grab this KPI PPT template for the innovative presentation about the key indicator and its uses to your audience. And explore our other slides of 100% editable and redesigned slides for the PPT presentation from SlideEgg.

    Features of the slide

    • 100% customizable slides and easy to download.
    • Slides are available in different nodes & colors.
    • The slides contained 16:9 and 4:3 formats.
    • Easy to change the slide colors quickly.
    • Well-crafted template with instant download facility.
    • The KPI slide for the PPT presentation.
    Advertisement

    You May Also Like These PowerPoint Templates

    Free
    Add to Wishlist
    Download
    AI Customize
    Dashboard slide with a world map highlighting countries, a bar chart showing statistics, and two percentage indicators.
    Add to Wishlist
    Download
    AI Customize
    Bar chart with colorful columns of varying heights representing percentages, with social media icons below.
    Add to Wishlist
    Download
    AI Customize
    Executive dashboard PowerPoint slide featuring line and bar charts, pie charts, and world map markers for data analysis.
    Add to Wishlist
    Download
    AI Customize
    Gantt chart with colorful horizontal bars spanning from January to June, representing project timelines and milestones.
    Free
    Add to Wishlist
    Download
    AI Customize
    Slide with line and trends charts, showing five columns of data with placeholder text for each chart segment.
    Free
    Add to Wishlist
    Download
    AI Customize
    Five-level bar chart executive dashboard with colored blocks labeled with five levels, showing a gradual progression.
    Free
    Add to Wishlist
    Download
    AI Customize
    PowerPoint slide with a bar chart showcasing three data series for different examples.
    Add to Wishlist
    Download
    AI Customize
    Dashboard themed PowerPoint slide with six gauges and captions for content.
    Add to Wishlist
    Download
    AI Customize
    Chart layout with stacked bar graphs in red, yellow, green, and teal representing A1 to A8, with captions above.
    Add to Wishlist
    Download
    AI Customize
    Infographic template with bar, pie, and world map charts for PowerPoint presentations in shades of red and orange.
    Add to Wishlist
    Download
    AI Customize
    3D cone charts in blue shades with percentage labels, showing two datasets with a legend on the right.
    Add to Wishlist
    Download
    AI Customize
    Our Predesigned KPI Presentation Template Slide Design
    Add to Wishlist
    Download
    AI Customize
    Modern dashboard PowerPoint template featuring circular progress charts, bar graphs, and key performance metrics.
    Free
    Add to Wishlist
    Download
    AI Customize
    Bar chart comparing increases and decreases for movies like Avatar and Aquaman, with title logos below.
    Add to Wishlist
    Download
    AI Customize
    Speedometer dashboard PowerPoint slides showing three colored gauges with 25, 50, and 75 percent progress with captions.
    Add to Wishlist
    Download
    AI Customize
    Executive Dashboard slide showing key performance metrics such as revenue vs. target, customer acquisition, and CAC vs. CLV.
    Free
    Add to Wishlist
    Download
    AI Customize
    Colorful project dashboard PPT slide showing a bar chart for four sections with a pie chart detailing percentages.