Innovative Project Dashboard PowerPoint And Google Slides


Effective Project Dashboard PowerPoint Template
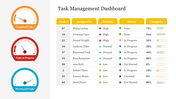
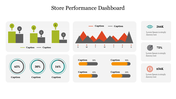
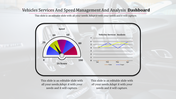
The Project Dashboard is a dynamic visual tool that provides top level executives and decision makers with a comprehensive overview of key performance indicators (KPIs) and critical project metrics. It provides a centralized platform to track project progress, track milestones, and identify areas that need attention. By summarizing relevant data, project dashboards empower stakeholders to monitor performance, allocate resources effectively, and ensure projects are on track to achieve their objectives. Project managers, team leaders, and stakeholders across industries can benefit from customizable templates with a variety of dashboard designs, layouts, and data visualization options, streamlining project reporting processes, and effectively communicating project insights. With fully editable slides, presenters can align the template with their project's branding and data needs, saving time in creating professional-quality project dashboards and effectively communicating key project insights to their audience. Encourage your audience to use this template to create dynamic and impactful project dashboards that drive project success and stakeholder satisfaction.
Features of this template
- 100% customizable slides and easy to download.
- The slide contains 16:9 and 4:3 formats.
- Easy to change the colors of the slide quickly.
- Highly compatible with PowerPoint and Google Slides.
- Well-crafted template with an instant download facility.
- Quick and easy edit features.


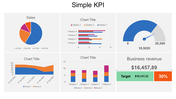
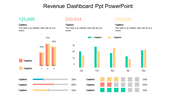
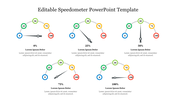
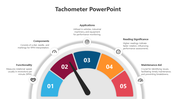
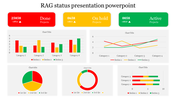
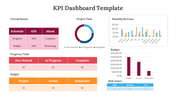
You May Also Like These PowerPoint Templates
Add to Wishlist
Download
AI Customize

Add to Wishlist
Download
AI Customize

Add to Wishlist
Download
AI Customize

Add to Wishlist
Download
AI Customize

Add to Wishlist
Download
AI Customize

Add to Wishlist
Download
AI Customize

Add to Wishlist
Download
AI Customize

Add to Wishlist
Download
AI Customize

Add to Wishlist
Download
AI Customize
Add to Wishlist
Download
AI Customize

Add to Wishlist
Download
AI Customize

Add to Wishlist
Download
AI Customize

Add to Wishlist
Download
AI Customize

Add to Wishlist
Download
AI Customize

Add to Wishlist
Download
AI Customize

Add to Wishlist
Download
AI Customize

Add to Wishlist
Download
AI Customize

Add to Wishlist
Download
AI Customize

Add to Wishlist
Download
AI Customize

Add to Wishlist
Download
AI Customize
