Sentiment Meter PPT Presentation Template & Google Slides

Sentiment meter infographic displaying six emotions in a colorful fan design, each labeled with placeholders text areas.
P.ID : 68044
    710 views
    31 Downloads
    Get Custom Slides by Experts
    Instantly Access Templates in PowerPoint

    Sentiment Presentation Slide

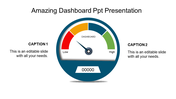
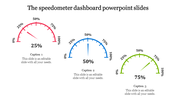
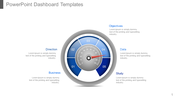
    Sentiment meters can be highly accurate in measuring people's emotions and opinions, but it depends on the quality of the data and the methodology used. They use algorithms that analyze language patterns, word choice, and context to determine sentiment. However, there can be challenges in accurately interpreting sarcasm, irony, and other forms of figurative language. Make use of this sentiment meter slide to study different emotions of the people and present the results obtained.


    Features of the Template:

    • 100% customizable slide and easy to download. 
    • The slide contained in 16:9 and 4:3 formats.
    • This slide has a colorful design pattern.
    • Highly compatible with PowerPoint and Google Slides.
    • Well-crafted template with instant download facility.
    • Creative design with text area.
    Advertisement

    You May Also Like These PowerPoint Templates

    Free
    Add to Wishlist
    Download
    AI Customize
    KPI dashboard bar chart slide representing the height of the world's tallest hills with a world map marking their locations.
    Free
    Add to Wishlist
    Download
    AI Customize
    Dashboard infographic with three gauge meters in blue, green, and yellow, each labeled with a number and caption.
    Add to Wishlist
    Download
    AI Customize
    KPI dashboard slide with line chart, showing performance for four categories, along with circular percentage indicators.
    Add to Wishlist
    Download
    AI Customize
    Speedometer KPI dashboard showing speed readings for three vehicles a truck, a van, and a car.
    Add to Wishlist
    Download
    AI Customize
    KPI dashboard PowerPoint slide showing a bar chart with active accounts for different categories and percentage indicators.
    Add to Wishlist
    Download
    AI Customize
    Six panel infographic featuring KPI metrics with colorful charts, graphs, and numerical data insights.
    Add to Wishlist
    Download
    AI Customize
    Central speedometer style gauge with red, yellow, blue, and green sections, surrounded by numbered text boxes.
    Add to Wishlist
    Download
    AI Customize
    Financial highlights slide with bar chart and circular gauges tracking sales, operating income, and expenses.
    Add to Wishlist
    Download
    AI Customize
    KPI dashboard with a dual-line graph, balance performance gauge, and quarterly income metrics.
    Free
    Add to Wishlist
    Download
    AI Customize
    Dashboard with line graphs, a circular chart with three segments, and labeled financial metrics, in red, orange, and green.
    Add to Wishlist
    Download
    AI Customize
    Dashboard slide showing Zantedeschia, Celosia, and Calendula growth data with a bar chart from 2012 to 2017.
    Add to Wishlist
    Download
    AI Customize
    Business dashboard with progress indicators for promotion, channel management, and revenue metrics.
    Add to Wishlist
    Download
    AI Customize
    A dashboard style slide showing plant growth data for Zantedeschia, Celosia, and Calendula with gauge charts and a bar graph.
    Add to Wishlist
    Download
    AI Customize
    Botanical data dashboard template  showing performance metrics for flower species, featuring line and bar charts.
    Add to Wishlist
    Download
    AI Customize
    PowerPoint slide with multiple chart types, including bar, line, and pie charts with different styles.
    Add to Wishlist
    Download
    AI Customize
    Colorful dashboard PPT template featuring financial figures, text placeholders, and a radar chart for visual data analysis.
    Free
    Add to Wishlist
    Download
    AI Customize
    Dashboard layout includes a line graph, pie chart, and three bar graphs, all colored in red, green, and blue.
    Free
    Add to Wishlist
    Download
    AI Customize
    Slide with multiple dashboard elements including bar charts, line charts, pie charts, and progress meters in various colors.