Creative KPI Dashboard PowerPoint Template Presentation

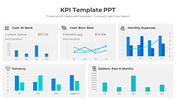

KPI Dashboard PowerPoint Templates and Google Slides
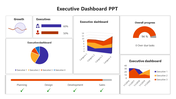
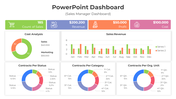
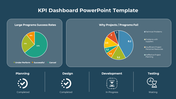
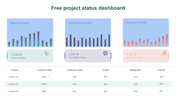
Enhance your business presentations with our dynamic KPI Dashboard PowerPoint template. Designed with sleek graphic elements and a harmonious blend of two nodes, this template not only offers a visually appealing representation of key performance indicators but also ensures a professional and engaging showcase of your data. The use of calming blue colors adds a touch of sophistication, making your information both clear and aesthetically pleasing. Whether you're analyzing project progress or evaluating business metrics, this free KPI Dashboard PowerPoint template is the perfect tool for your presentation needs. Elevate your end slides with a modern touch, reflecting your commitment to excellence in graphic design and delivering impactful insights. Perfect for business professionals seeking an efficient and visually appealing solution for their presentation requirements, this template seamlessly combines functionality and aesthetics for a compelling visual experience.
Features of the template:
- Slides are available in different nodes & colors.
- Easy to change the slide colors.
- Well-crafted template with instant download.
- 100 % customizable slides and easy to download.
- Well-crafted template with instant download.


You May Also Like These PowerPoint Templates
Add to Wishlist
Download
Edit

Add to Wishlist
Download
Edit

Add to Wishlist
Download
Edit

Add to Wishlist
Download
Edit


Add to Wishlist
Download
Edit

Add to Wishlist
Download
Edit

Add to Wishlist
Download
Edit

Add to Wishlist
Download
Edit

Add to Wishlist
Download
Edit

Add to Wishlist
Download
Edit

Add to Wishlist
Download
Edit

Add to Wishlist
Download
Edit

Add to Wishlist
Download
Edit

Add to Wishlist
Download
Edit

Add to Wishlist
Download
Edit

Add to Wishlist
Download
Edit

Add to Wishlist
Download
Edit
