Free - Sales And Marketing Strategy Template in Chart Model
Free


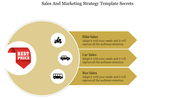


Sales And Marketing Strategy Template
Get our best Sales And Marketing Strategy Template to illustrate development in sales and market share. This template will assist you in analyzing the current sales and marketing system. This template is mainly used in a business meeting or company sale meeting. The Chart designs of this PowerPoint help increase the interest of the audience. In addition, this template has Four categories to add your information. It is a pre-built slide with all the essential elements. You can edit the icon colors and text in this template. We also have a wide range of Sales chart PPT slides.
Feature of this template
- This template is fully editable.
- Fully Customizable (shape color, size & text)
- This template has a Multicolor theme, and you can also choose the color
- Drag and drop image placeholder
- Huge Collections of slides to impress your audience
- It supports an aspect ratio of 16:9.
- Easily readable and acceptable template.


You May Also Like These PowerPoint Templates
Add to Wishlist
Download
Edit

Add to Wishlist
Download
Edit

Add to Wishlist
Download
Edit


Add to Wishlist
Download
Edit

Add to Wishlist
Download
Edit

Add to Wishlist
Download
Edit

Add to Wishlist
Download
Edit

Add to Wishlist
Download
Edit

Add to Wishlist
Download
Edit


