MILESTONE 🌟 5 Million+ creative minds trust SlideEgg! Grab 80% OFF

Get tantalizing Tachometer PPT Download Free slides

Colorful tachometer PowerPoint slide design with transportation icons including airplane, car, bus, and train with captions.
P.ID : 48944
    349 views
    38 Downloads
    Get Custom Slides by Experts
    Instantly Access Templates in PowerPoint

    Differently Designed Tachometer Template

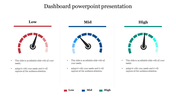
    The steering wheel diagram in the center and the icons boost your points in a highlighting manner. When you notice the icons, you will find different vehicles such as airplanes, buses, cars, and vans inserted. You can bring in speed and steering control points through the icons. The four nodes are spacious; even the font style used here is bold and beautiful. The outstanding feature here is the combination of colors used, which are a visual treat to the audience. Finally, there is no time left for you to hold this template in hand.

    Features of the template

    • 100% customizable slides and easy to download
    • Slides are available. Vacation Themed Template
    • The slides contained 16:9 and 4:3 formats.
    • Easy to change the slide colors quickly.
    • Well-crafted template with instant download facility.
    • One of the attractive templates from SlideEgg.
    • Engaging nodes are inserted.
    Advertisement

    You May Also Like These PowerPoint Templates

    Free
    Add to Wishlist
    Download
    AI Customize
    Dashboard layout with three semicircular gauges in orange and brown tones, paired with captions, on a beige background.
    Add to Wishlist
    Download
    AI Customize
    Project management dashboard with bar charts, numerical data panels, and color-coded sections.
    Add to Wishlist
    Download
    AI Customize
    Dashboard-themed slide with semi-circle charts for business analysis, featuring metrics and reflective silhouettes at the bottom.
    Add to Wishlist
    Download
    AI Customize
    Bar chart infographic with four blue bars for kpi forecasts, a line graph overlay, and a man with a magnifying glass.
    Add to Wishlist
    Download
    AI Customize
    Executive dashboard slide featuring bar graphs and pie charts comparing project data over three years, with text boxes.
    Add to Wishlist
    Download
    AI Customize
    Four colored circular progress, one is higlighted in a box with a pie chart, and a bar chart labelled with sections.
    Add to Wishlist
    Download
    AI Customize
    Comprehensive program dashboard featuring charts and gauges for quality, budget, risks, overall project map, progress, and resource updates.
    Free
    Add to Wishlist
    Download
    AI Customize
    Four black speedometers with white numbers and yellow markers arranged in a two by two grid with descriptions.
    Add to Wishlist
    Download
    AI Customize
    KPI infographic slide deck, combining line and bar graphs,  pie charts, and performance dials for data representation.
    Add to Wishlist
    Download
    AI Customize
    Semi circular gauge in shades of brown and peach with a pointer, alongside text and a silhouette group at the bottom.
    Free
    Add to Wishlist
    Download
    AI Customize
    An executive dashboard showing income and expense distribution, with key financial metrics and a line graph.
    Add to Wishlist
    Download
    AI Customize
    Semi circular gauge with six color coded sections from green to red, With numbers 01 to 06, labeled KPI at the bottom.
    Add to Wishlist
    Download
    AI Customize
    A collection of isometric KPI infographic slides showcasing bar graphs, pie charts, and performance metrics with icons.
    Add to Wishlist
    Download
    AI Customize
    Slide with blue stats on the left and various charts, including bar and pie charts in different colors.
    Add to Wishlist
    Download
    AI Customize
    Comprehensive project dashboard template with progress charts, data bars, and financial performance indicators.
    Add to Wishlist
    Download
    AI Customize
    KPI dashboard featuring financial data with profit trends and metrics visualized through charts and dials.