Creative Dashboard PPT Templates For Presentation

A slide displaying dashboard elements like bar graphs, a world map with data points, and progress bars, with captions.
P.ID : 52686
    655 views
    123 Downloads
    Get Custom Slides by Experts
    Instantly Access Templates in PowerPoint

    Amazing Dashboard Slide Presentation

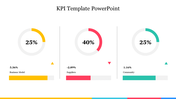
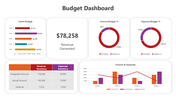
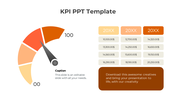
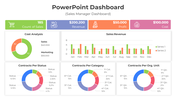
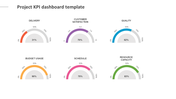
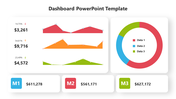
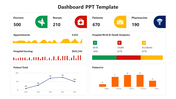
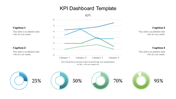
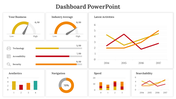
    Provide your information with a single glance! If you are an entrepreneur of a worldwide business, make this template a part of the presentation to explain your global trades. The template is colorfully crafted with a world map, bar graphs, pie charts, and a loop to explain your statistical data easily. All the features in the slide are entirely editable for your convenience. Decide to show your content in a nutshell.

    Features of the template

    • 100 % customizable slides and easy to download.
    • Slides are available in different colors
    • The slide has 4:3 and 16:9 formats.
    • Easy to change the slide colors quickly.
    • Appealing presentation to impress an audience
    • Create feature-rich slide presentations. 
    • An eye-pleasing color slide helps to give a catchy presentation.
    • Huge space to add texts independently.
    Advertisement

    You May Also Like These PowerPoint Templates

    Add to Wishlist
    Download
    AI Customize
    Dashboard layout showing net worth value, asset categories in a pie chart, and bar chart for real estate comparisons.
    Add to Wishlist
    Download
    AI Customize
    Slide showcasing data visualizations using donut, bar, column, line charts, and a text box, using yellow highlights.
    Add to Wishlist
    Download
    AI Customize
    Business dashboard slide with a monitor displaying charts and graphs, paired with four colored icons and captions.
    Add to Wishlist
    Download
    AI Customize
    Slide design featuring three green speedometer graphics displaying different progress levels, each paired with a caption.
    Add to Wishlist
    Download
    AI Customize
    Sales performance dashboard with four circular progress charts in orange, blue, purple, and green, showing percentage values.
    Add to Wishlist
    Download
    AI Customize
    Project dashboard slide with a compass design,  featuring four labeled captions, and an orange sidebar for text.
    Add to Wishlist
    Download
    AI Customize
    Dashboard slide featuring six sections with graphs and metrics for annual performance in blue and green.
    Add to Wishlist
    Download
    AI Customize
    Project risk assessment executive dashboard with four columns and multiple rows, all labeled as placeholder text.
    Add to Wishlist
    Download
    AI Customize
    Effective Dashboard PowerPoint Templates Design
    Add to Wishlist
    Download
    AI Customize
    Dashboard slide featuring a stacked bar chart in red, green, and purple, and two speedometer gauge indicators below.
    Add to Wishlist
    Download
    AI Customize
    Dashboard slide with a circular chart in blue shades, featuring percentage labels, and five icons with text on the right.
    Add to Wishlist
    Download
    AI Customize
    Dashboard slide with a pie chart, stacked area chart, and multiple colored rectangular boxes displaying metrics.
    Add to Wishlist
    Download
    AI Customize
    KPI dashboard slide with metrics for Visits, Visitors, Conversion rate, and Revenue per user along with views per device.
    Add to Wishlist
    Download
    AI Customize
    Best Dashboard Sales Performance Reports Revenue Charts
    Add to Wishlist
    Download
    AI Customize
    Dashboard with bar chart comparing planned vs. actual tasks for projects, pie chart for project share, and a line graph displaying project data.
    Add to Wishlist
    Download
    AI Customize
    Green themed chart layout featuring bar graphs, pie charts, line graphs, and a world map for diverse data visualization.
    Add to Wishlist
    Download
    AI Customize
    Gray slide layout with a semicircular gauge in gradient colors of red, orange, and green, and a sidebar with text.
    Add to Wishlist
    Download
    AI Customize
    Project comparison table with sections for team members, location, costs, and risk before and after changes.
    Add to Wishlist
    Download
    AI Customize
    KPI dashboard slide with key metrics for business, development, and downloads, showing percentages with icons.