Easy To Customizable KPI Template PPT And Google Slides

KPI PowerPoint template with a gauge and table for displaying yearly financial data on a white backdrop.
P.ID : 46915
    682 views
    107 Downloads
    Get Custom Slides by Experts
    Instantly Access Templates in PowerPoint

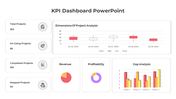
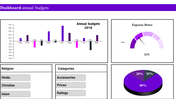
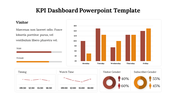
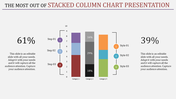
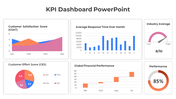
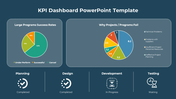
    KPI PowerPoint Template


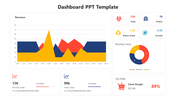
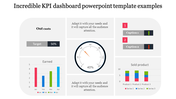
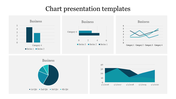
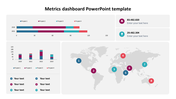
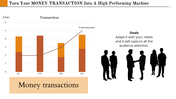
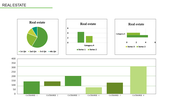
    Key Performance Indicators (KPIs) function as measurable metrics that assess a company's performance in achieving its objectives. These quantifiable values, spanning revenue growth to customer satisfaction, offer valuable insights into organizational effectiveness, guiding strategic decisions and pinpointing areas for enhancement. The KPI PowerPoint template simplifies the presentation of intricate performance data, catering to executives, managers, analysts, and consultants across diverse industries. Featuring customizable slides, users can effortlessly showcase KPI trends, comparisons, and analyses, tailoring content to specific requirements. The template's intuitive design facilitates clear and concise communication of critical insights, enhancing audience engagement and supporting informed decision-making. Whether addressing stakeholders or internal teams, this template streamlines the presentation process, enabling presenters to effectively convey the importance of KPIs in driving organizational success. With fully editable slides, users enjoy flexibility in adapting content to preferences, ensuring a seamless presentation experience. Empower your presentations with the KPI template, harness the power of data-driven decision-making, and propel your organization towards its objectives.

    Features of this template


    • 100% customizable slides and easy to download.
    • The slide contains 16:9 and 4:3 formats.
    • Easy to change the colors of the slide quickly.
    • Highly compatible with PowerPoint and Google Slides.
    Advertisement

    You May Also Like These PowerPoint Templates

    Free
    Add to Wishlist
    Download
    AI Customize
    PowerPoint template featuring a colorful dashboard with bar graphs, pie charts, progress rings, and a timeline for data.
    Add to Wishlist
    Download
    AI Customize
    Dashboard showing expense meters, global percentages on a map, and a bar chart visualizing data distribution.
    Add to Wishlist
    Download
    AI Customize
    Slide deck with KPI charts and graphs for business analysis, including financials, HR performance, and customer service.
    Add to Wishlist
    Download
    AI Customize
    KPI dashboard template with a line chart, progress indicators, and bar graphs showing different performance metrics.
    Free
    Add to Wishlist
    Download
    AI Customize
    Free KPI PPT Template For Presentation & Google Slides
    Free
    Add to Wishlist
    Download
    AI Customize
    Vertical bars in purple, blue, green, yellow, orange, and pink showing percentages, next to a businesswoman.
    Free
    Add to Wishlist
    Download
    AI Customize
    Dashboard layout includes a line graph, pie chart, and three bar graphs, all colored in red, green, and blue.
    Free
    Add to Wishlist
    Download
    AI Customize
    Project dashboard slide for electricity data with bar graphs showing units and amounts for different categories and months.
    Add to Wishlist
    Download
    AI Customize
    KPI dashboard template with progress bars, pie chart, bar graphs, and workload metrics in a clean blue theme.
    Add to Wishlist
    Download
    AI Customize
    Dark themed data dashboard with blue line and bar charts, a circular stat gauge, and numerical metrics for analysis.
    Add to Wishlist
    Download
    AI Customize
    Dashboard slide showing business performance, including technology, accessibility, and security scores with activity graphs.
    Add to Wishlist
    Download
    AI Customize
    KPI dashboard slide featuring six charts vertical bars, horizontal bars, area graph, pie chart, and column bar graphs.
    Free
    Add to Wishlist
    Download
    AI Customize
    KPI PPT Template with three colourful circular progress charts  showing percentages, growth indicators, and  bar charts.
    Add to Wishlist
    Download
    AI Customize
    KPI dashboard slide showing multiple charts, including bar, line, pie, and gauge charts with tracking business data.
    Free
    Add to Wishlist
    Download
    AI Customize
    KPI Template PPT Presentation Slide With Bar Chart