KPI Dashboard PowerPoint Template and Google Slides Themes


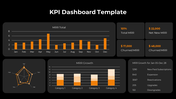
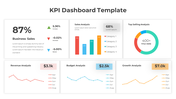
KPI Dashboard Presentation Template
Tired of boring data dashboards? Add some excitement with our lively KPI Dashboard Presentation Templates!
Start creating your KPI playground like a fun puzzle, easily dragging and dropping key metrics, and adding playful icons for each data point with our elegant KPI templates. No design stress! Just pick a theme, add your KPIs with a click, and voila! Your dashboard is bursting with personality. Our easy-t-use template is like a brainstorming buddy, encouraging creativity and making data analysis a breeze. No more dull spreadsheets or uninspiring presentations.
Whether you're a team leader inspiring collaboration for performance improvement, a student explaining class project metrics, or a community leader promoting data-driven solutions, these templates are your secret weapon. Spark lively discussions, foster shared accountability, and own the room with an energetic approach to data visualization.
So, no more dull templates. Download our KPI Dashboard PowerPoint Templates and celebrating data-driven success together.
Features of the template:
- Slides are available in different nodes & colors.
- 100 % customizable slides and easy to download.


You May Also Like These PowerPoint Templates


Add to Wishlist
Download
Edit

Add to Wishlist
Download
Edit

Add to Wishlist
Download
Edit

Add to Wishlist
Download
Edit

Add to Wishlist
Download
Edit

Add to Wishlist
Download
Edit

Add to Wishlist
Download
Edit

Add to Wishlist
Download
Edit

Add to Wishlist
Download
Edit


Add to Wishlist
Download
Edit


Free
Add to Wishlist
Download
Edit

Free
Add to Wishlist
Download
Edit


Showing20 of69,218 templates