Simple KPI Dashboard PowerPoint Template And Google Slides

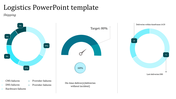
KPI Dashboard PowerPoint Template
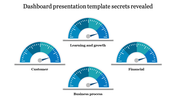
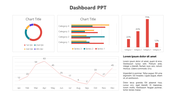
Elevate your business performance monitoring with the KPI Dashboard template, a powerful tool designed to provide a comprehensive visual representation of key performance indicators (KPIs) across your organization. By consolidating critical metrics such as financial performance, customer satisfaction, employee productivity, and more into a single, easy-to-understand dashboard, this template enables stakeholders to track progress, identify trends, and make data-driven decisions in real-time. With customizable features and intuitive design options, the KPI template allows you to tailor your dashboard to your specific business goals and objectives. Whether you're a small business owner or a corporate executive, this template empowers you to gain valuable insights, optimize strategies, and drive continuous improvement across your organization. Download the KPI Dashboard PPT template today to unlock the power of performance monitoring and propel your business towards success.
Features of this template
- 100% customizable slides and easy to download.
- Slides are available in different nodes & colors.
- The slide contained 16:9 and 4:3 formats.
- Easy to change the slide colors quickly.
- It is a well-crafted template with an instant download facility.


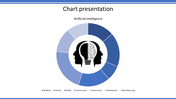
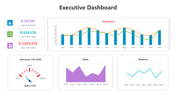
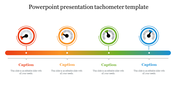
You May Also Like These PowerPoint Templates

Add to Wishlist
Download
Edit


Add to Wishlist
Download
Edit

Add to Wishlist
Download
Edit

Add to Wishlist
Download
Edit


Add to Wishlist
Download
Edit

Add to Wishlist
Download
Edit

Add to Wishlist
Download
Edit

Add to Wishlist
Download
Edit


Add to Wishlist
Download
Edit


Add to Wishlist
Download
Edit

Add to Wishlist
Download
Edit

Add to Wishlist
Download
Edit

Add to Wishlist
Download
Edit

Add to Wishlist
Download
Edit
