Easy To Editable Dashboard PowerPoint And Google Slides

Dashboard PowerPoint slide featuring pie, bar, and line charts with placeholder text and data visualization.
P.ID : 17252
    563 views
    45 Downloads
    Get Custom Slides by Experts
    Instantly Access Templates in PowerPoint

    Dashboard PowerPoint Template and Google Slide


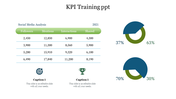
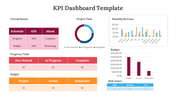
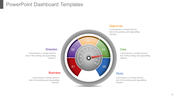
    The Dashboard PPT template provides an easy way to create engaging presentations that clearly convey complex data and insights. Dashboards offer a visual representation of key performance indicators (KPIs) and metrics, giving a comprehensive view of an organization’s performance in real time.

    What is a Dashboard PPT?

    A Dashboard PPT consolidates data from various sources into a single, easy-to-read slide. It allows stakeholders to monitor progress, spot trends, and make data-driven decisions effectively. With fully editable slides, you can customize content, adjust visuals, and tailor the presentation to meet specific audience needs.

    Purpose of the Slide

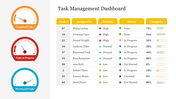
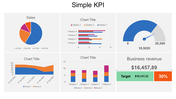
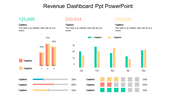
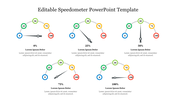
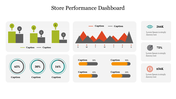
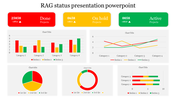
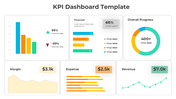
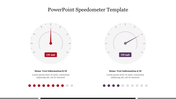
    This template includes charts, bar charts, and circle charts, making it ideal for showcasing data visually. Whether you need to present sales figures, project updates, or performance reviews, the Dashboard slide helps you streamline communication and enhance understanding.

    Who Can Use This Template?

    Business professionals, students, analysts, managers, and executives will find this template particularly useful. Its versatility suits various purposes, including business reviews, academic presentations, and strategic discussions.

    Act Now!

    Features of the template:


    • 100% customizable slides and easy to download.
    • The slides contain 16:9 and 4:3 formats.
    • Easy to change the colors quickly.
    • It is a 100% pre-designed slide.
    Advertisement

    You May Also Like These PowerPoint Templates

    Add to Wishlist
    Download
    AI Customize
    3D sales chart displaying a 60 percent sales progress with an informative text section and interactive button on blue theme.
    Add to Wishlist
    Download
    AI Customize
    Colorful business analytics dashboard displaying bar graphs, line charts, and percentage indicators in a structured layout.
    Add to Wishlist
    Download
    AI Customize
    Dashboard layout with income, expenses, profit, and cash flow figures on the left, a project budget chart in the center.
    Add to Wishlist
    Download
    AI Customize
    Sales report slide showing metrics like sales volume, profit margin, and a gauge chart along with a bar graph.
    Add to Wishlist
    Download
    AI Customize
    Dashboard template with pink charts showing facebook and twitter activity, percentage rings, and a page growth graph.
    Add to Wishlist
    Download
    AI Customize
    Sentiment meter infographic displaying six emotions in a colorful fan design, each labeled with placeholders text areas.
    Add to Wishlist
    Download
    AI Customize
    KPI Dashboard PowerPoint template displaying key metrics, including count of contracts, revenues, and costs.
    Add to Wishlist
    Download
    AI Customize
    Tachometer template with percentage markers and color-coded designs, each paired with caption areas.
    Add to Wishlist
    Download
    AI Customize
    Executive dashboard template showcasing growth, progress, and performance metrics for effective management.
    Add to Wishlist
    Download
    AI Customize
    KPI slide showcasing cash flow metrics and financial performance over six months in different bar chat layouts.
    Add to Wishlist
    Download
    AI Customize
    Amazing Dashboard PowerPoint Template And Google Slides
    Add to Wishlist
    Download
    AI Customize
    Dashboard slide with two green gauge meters, each labeled with a caption and text below.
    Add to Wishlist
    Download
    AI Customize
    Editable KPI Dashboard PowerPoint And Google Slides
    Add to Wishlist
    Download
    AI Customize
    Microsoft dashboard slide showcasing supply chain costs, inventory to sales ratio, and carrying cost of inventory.
    Add to Wishlist
    Download
    AI Customize
    Project status dashboard slide displaying budgets and performance metrics for banners, social media, and brochures.
    Add to Wishlist
    Download
    AI Customize
    PowerPoint slide with a tachometer graphic showing numbers 1 through 8 in different colors, with placeholders for captions.
    Add to Wishlist
    Download
    AI Customize
    Colorful tachometer PowerPoint slide design with transportation icons including airplane, car, bus, and train with captions.
    Add to Wishlist
    Download
    AI Customize
    Ten speedometer icons in two rows, each with blue, green, and red segments, ranging from 0 to 100.