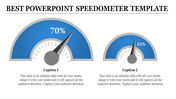
Editable Speedometer PowerPoint Template Presentation

 Canva
Canva
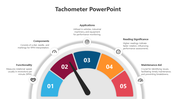

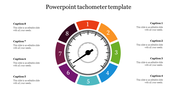
Five Noded Speedometer PPT Slide
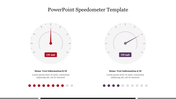
Make excellent dashboard presentations with this Editable Speedometer PowerPoint Template. It is a beautifully designed, 100% editable presentation template that allows you to design a professional-looking presentation easily. It will help you present different KPI metrics in an effective manner.
About the template:
The Editable Speedometer PowerPoint Template is a five-noded presentation template with five multicolor speedometers. Each speedometer indicates different values, and catchy colors are used to show the values from 0 to 100. It also includes text holders to present your content. SlideEgg also offers Free PowerPoint Speedometer Templates of premium quality.
Features of this template:
1. 100% customizable slides and easy to download.
2. Slides available in different nodes & colors.
3. The slide contained 16:9 and 4:3 formats.
4. Easy to change the slide colors quickly.
5. Well-crafted template with instant download facility.
6. It has colorful speedometers.


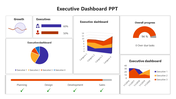
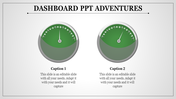
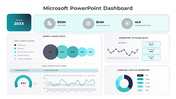
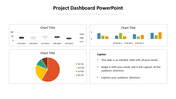
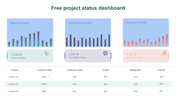
You May Also Like These PowerPoint Templates
Add to Wishlist
Download
AI Customize

Add to Wishlist
Download
AI Customize

Add to Wishlist
Download
AI Customize

Add to Wishlist
Download
AI Customize

Add to Wishlist
Download
AI Customize

Add to Wishlist
Download
AI Customize

Add to Wishlist
Download
AI Customize

Add to Wishlist
Download
AI Customize

Add to Wishlist
Download
AI Customize

Add to Wishlist
Download
AI Customize

Add to Wishlist
Download
AI Customize


Add to Wishlist
Download
AI Customize

Add to Wishlist
Download
AI Customize

Add to Wishlist
Download
AI Customize

Add to Wishlist
Download
AI Customize

Add to Wishlist
Download
AI Customize

Add to Wishlist
Download
AI Customize

Add to Wishlist
Download
AI Customize

Add to Wishlist
Download
AI Customize
