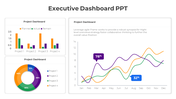
Editable Executive Dashboard PPT And Google Slides

Executive dashboard template showcasing growth, progress, and performance metrics for effective management.
P.ID : 3988
    2.4K+ views
    251 Downloads
    Get Custom Slides by Experts
    Instantly Access Templates in PowerPoint

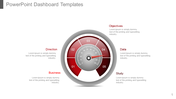
    Creative Dashboard PowerPoint Template


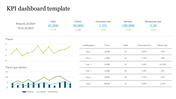
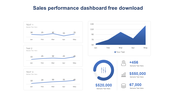
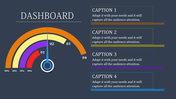
    An executive dashboard serves as a dynamic visual tool, ideal for top executives and decision makers, with a detailed overview of key performance indicators (KPIs) and critical business metrics. It serves as a centralized platform for tracking organizational performance, tracking progress toward strategic goals, and identifying significant trends or areas that require attention. By providing relevant data in a concise and accessible format, executive dashboards empower leaders to accelerate informed decision-making processes, thereby promoting strategic planning and organizational success. This template caters to executives, senior managers and decision makers in industries, offering customizable designs, layouts and data visualization options. It helps streamline reporting processes, track KPIs and effectively communicate insights to stakeholders, while its fully editable slides help align with organizational branding and data needs, ensuring maximum impact and engagement. Benefits include saving time designing professional quality management dashboards and efficiently communicating key insights to audiences, enabling informed decision making and fostering organizational success. Encourage users to use this template to create dynamic and impactful management dashboards that drive organizational success.


    Features of this template


    • 100% customizable slides and easy to download.
    • The slide contains 16:9 and 4:3 formats.
    • Easy to change the colors of the slide quickly.
    • Highly compatible with PowerPoint and Google Slides.
    • Well-crafted template with an instant download facility.
    • Quick and easy edit features. 
    Advertisement

    You May Also Like These PowerPoint Templates

    Add to Wishlist
    Download
    AI Customize
    A slide showcasing four different chart types from Column Histogram to Scatter Plot with corresponding data.
    Add to Wishlist
    Download
    AI Customize
    Project summary dashboard showing project statistics, budget, actual performance, and project performance by category.
    Add to Wishlist
    Download
    AI Customize
    Circular gauge template with sections in red, orange, yellow, green, and dark green, with captions on either side.
    Add to Wishlist
    Download
    AI Customize
    Sashboard design featuring three plant species data and corresponding progress meters in red, green, and blue.
    Free
    Add to Wishlist
    Download
    AI Customize
    Executive dashboard slide with five numbered circular icons on dark blue shapes, each labeled with key principles.
    Add to Wishlist
    Download
    AI Customize
    KPI dashboard template PowerPoint slide featuring three sections for data visualization.
    Add to Wishlist
    Download
    AI Customize
    Dashboard layout including a bar chart of company data, a pie chart for quarterly sales distribution.
    Add to Wishlist
    Download
    AI Customize
    Dashboard gauges with red, yellow, green indicators showing low, medium, high performance against a gray background.
    Free
    Add to Wishlist
    Download
    AI Customize
    Pie chart in orange, red, green, and blue sections with two text labels on either side, highlighting sales performance.
    Add to Wishlist
    Download
    AI Customize
    KPI dashboard slide with key metrics for business, development, and downloads, showing percentages with icons.
    Add to Wishlist
    Download
    AI Customize
    Attractive PowerPoint KPI Dashboard Presentation Template
    Add to Wishlist
    Download
    AI Customize
    Dashboard gauge chart PPT template with color coded sections for big loss, loss, break even, profit, and high profit.
    Add to Wishlist
    Download
    AI Customize
    Internet speed dashboard featuring two routers with speed performance indicators and mobile phones.
    Free
    Add to Wishlist
    Download
    AI Customize
    Six-layer bullseye diagram executive dashboard with annotations on each layer, arranged symmetrically around the circle.
    Free
    Add to Wishlist
    Download
    AI Customize
    Free KPI PPT Template For Presentation & Google Slides
    Free
    Add to Wishlist
    Download
    AI Customize
    KPI PPT Template with three colourful circular progress charts  showing percentages, growth indicators, and  bar charts.