Four Noded Dashboard PPT Template for Data Visualization


Dashboard PowerPoint Template and Google Slides
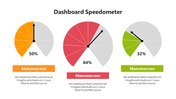
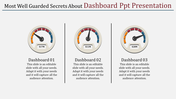
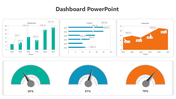
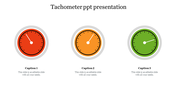
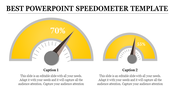
The "Dashboard PowerPoint Template and Google Slides" is a visual tool designed to represent key performance indicators (KPIs), metrics, or data insights in a dashboard format. It features four gauges labeled "Dashboard 01" through "Dashboard 04," each displaying different values. The gauges are presented in different colors, enhancing visual appeal and differentiation.
This template is suitable for professionals across various industries who need to present data-driven insights or performance metrics clearly and concisely. It caters to executives, managers, analysts, or consultants who are responsible for monitoring and communicating key metrics to stakeholders, team members, or clients.
Compatible with both PowerPoint and Google Slides, ensuring seamless integration into your presentation workflow. Available in "16:9" and "4:3" aspect ratios and zip formats to accommodate different presentation environments and screen sizes. It is free to download and fully customizable.


You May Also Like These PowerPoint Templates
Add to Wishlist
Download
Edit

Add to Wishlist
Download
Edit


Add to Wishlist
Download
Edit

Add to Wishlist
Download
Edit

Add to Wishlist
Download
Edit

Add to Wishlist
Download
Edit

Add to Wishlist
Download
Edit

Add to Wishlist
Download
Edit

Add to Wishlist
Download
Edit

Add to Wishlist
Download
Edit

Add to Wishlist
Download
Edit

Add to Wishlist
Download
Edit

Add to Wishlist
Download
Edit

Add to Wishlist
Download
Edit

Add to Wishlist
Download
Edit

Add to Wishlist
Download
Edit

Add to Wishlist
Download
Edit


Add to Wishlist
Download
Edit
