Dashboard PPT Template and Google Slides

Dashboard slide showcasing a semi circular layout with five numbered segments in blue, red, and green, each with captions.
P.ID : 18733
    420 views
    16 Downloads
    Get Custom Slides by Experts
    Instantly Access Templates in PowerPoint

    Dashboard PPT Template and Google Slides

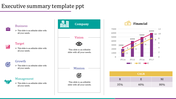
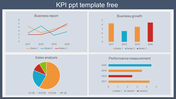
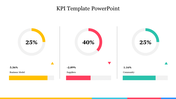
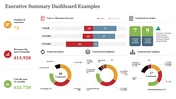
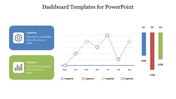
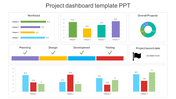
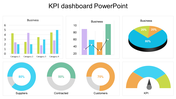
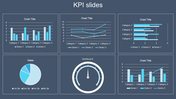
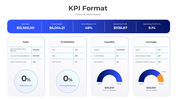
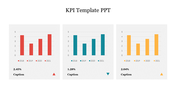
    The "Dashboard PPT Template and Google Slides" is a versatile tool designed for creating business dashboards and data-driven presentations. It features a user-friendly layout divided into five sections, each accompanied by a caption and a number. This template serves as an effective platform for organizing and presenting key business metrics, performance indicators, project statuses, and other relevant data in a visually appealing and easy-to-understand format.

    This template is ideal for professionals across various industries, including business executives, project managers, analysts, consultants, and educators. Utilize this template whenever you need to create presentations focused on business performance, data analysis, or decision-making.

    Compatibility with both PowerPoint and Google Slides, ensuring seamless integration and accessibility across different presentation platforms. Availability in "16:9" and "4:3" aspect ratios and zip formats to accommodate diverse presentation settings and screen resolutions. It is free to download and fully customizable
    Advertisement

    You May Also Like These PowerPoint Templates

    Free
    Add to Wishlist
    Download
    AI Customize
     Sales Dashboard PPT Template & Google Slide Themes
    Add to Wishlist
    Download
    AI Customize
    Three speedometer charts slide with captions indicating different data points, highlighted in green, yellow, and orange.
    Free
    Add to Wishlist
    Download
    AI Customize
    Free Dashboard PowerPoint Template Design template
    Add to Wishlist
    Download
    AI Customize
    Three semi circle gauges in pastel colors, with percentage labels above, and related text and icons beneath.
    Add to Wishlist
    Download
    AI Customize
    Four semi circular charts showing shipment percentages by country, with icons below for delivery status and order rates.
    Add to Wishlist
    Download
    AI Customize
    Three speedometers showing progress percentages: 25%, 50%, and 75%, with gradient colors in yellow, orange, and red.
    Add to Wishlist
    Download
    AI Customize
    KPI report slide displaying software sales, downloads, and attendance metrics with speedometer gauges and growth indicators.
    Add to Wishlist
    Download
    AI Customize
    Metrics Dashboard PowerPoint Template & Google Slides
    Free
    Add to Wishlist
    Download
    AI Customize
    Slide with three gauge meters in orange, yellow, and gray, each paired with a table for KPI metrics.
    Free
    Add to Wishlist
    Download
    AI Customize
    KPI presentation template displaying colorful charts for revenue, units sold, and product category analysis.
    Free
    Add to Wishlist
    Download
    AI Customize
    Project management dashboard slide showing various tasks in planning, design with workload, and budget charts.
    Free
    Add to Wishlist
    Download
    AI Customize
    Real estate KPI dashboard showing quarterly data in a green colored pie chart and bar graphs across various categories.
    Add to Wishlist
    Download
    AI Customize
    Speedometer clipart slide featuring three gauges at 25%, 50%, and 75% with space for descriptive text below each.
    Free
    Add to Wishlist
    Download
    AI Customize
    KPI slide displaying key performance indicators with many sections and accompanying data charts.
    Add to Wishlist
    Download
    AI Customize
    Dashboard slide showcasing project management KPIs with bar graphs, a line graph, and a pie chart in different colors.
    Add to Wishlist
    Download
    AI Customize
    Logistics KPI PowerPoint Template and Google Slides