RAG Status Presentation PPT Template and Google Slides

RAG status slide with a task table featuring colored status indicators and four charts, including pie and line graphs.
P.ID : 51086
    2.9K+ views
    351 Downloads
    Get Custom Slides by Experts
    Instantly Access Templates in PowerPoint

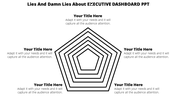
    Five Noded RAG Status PowerPoint Slide


    Download this RAG Status Presentation PPT Template with multicolor nodes to present the RAG status of the project. It is a highly flexible slide that can fit any kind of project. It is very attractive and easy to use. It also comes with 100% editable elements, which will enable you to personalize the appearance if necessary.

    About the template


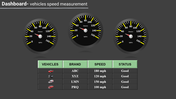
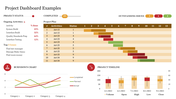
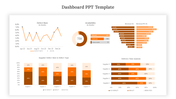
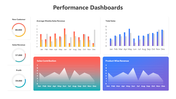
    The RAG Status Presentation PPT Template is a five-noded slide with a well-crafted dashboard. It is designed with tables and charts, showing the RAG status clearly and effectively. It has eye-catching colors and fully editable charts. Using this slide, you can visualize the tasks, assigned to details, priority, status, and milestones of your projects. Find more professional PowerPoint templates from SlideEgg!

    Features of the template

    • 100% customizable slides and easy to download.
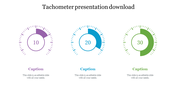
    • Slides are available in different nodes & colors.
    • The slide contained 16:9 and 4:3 formats.
    • Easy to change the slide colors quickly.
    • Well-crafted template with instant download facility.
    • It has a colorful dashboard to show the RAG status.
    Advertisement

    You May Also Like These PowerPoint Templates

    Add to Wishlist
    Download
    AI Customize
    Blue themed dashboard layout with a line chart, two growth metrics, and three semi circle gauges for budget.
    Add to Wishlist
    Download
    AI Customize
    Three circular dashboard dials with red, blue, and brown segments, each containing captions below.
    Add to Wishlist
    Download
    AI Customize
    Slide featuring a dashboard with three dials labeled Low, Mid, and High, indicating various levels of measurement.
    Free
    Add to Wishlist
    Download
    AI Customize
    Circular speedometer with orange and gray segments, displaying kilometer markings from 5.5 KM to 8 KM.
    Free
    Add to Wishlist
    Download
    AI Customize
    Dashboard graphic featuring a circular speedometer with a red needle, surrounded by text labels for various business metrics.
    Add to Wishlist
    Download
    AI Customize
    Speedometer slide with three colorful gauges showing percentages each with captions.
    Add to Wishlist
    Download
    AI Customize
    Dashboard with a red line graph for Jan-May and a bar chart of four colored percentage bars and category icons.
    Free
    Add to Wishlist
    Download
    AI Customize
    PowerPoint slide showcasing projected cash flows, NPV for 3 and 5 years, and payback period with client testimonial.
    Add to Wishlist
    Download
    AI Customize
    Three panel dashboard with column, bar, and funnel charts at the top and numbered blue boxes with text below.
    Free
    Add to Wishlist
    Download
    AI Customize
    Dashboard with line chart for appointments, bar chart from hospital earnings to patient totals, and intake by category.
    Add to Wishlist
    Download
    AI Customize
    Slide deck of energy dashboards displaying data visualizations like pie charts, bar and line graphs, in green shades.
    Free
    Add to Wishlist
    Download
    AI Customize
    KPI dashboard layout with blue semicircle gauges and line charts representing social media performance metrics.
    Free
    Add to Wishlist
    Download
    AI Customize
    Dashboard layout with three semicircular gauges in orange and brown tones, paired with captions, on a beige background.
    Add to Wishlist
    Download
    AI Customize
    Project management dashboard with bar charts, numerical data panels, and color-coded sections.
    Add to Wishlist
    Download
    AI Customize
    Dashboard-themed slide with semi-circle charts for business analysis, featuring metrics and reflective silhouettes at the bottom.