Free - KPI Dashboard PowerPoint Template For Business Management

Free
PowerPoint slide showcasing projected cash flows, NPV for 3 and 5 years, and payback period with client testimonial.
P.ID : 2136
    851 views
    84 Downloads
    Get Custom Slides by Experts
    Instantly Access Templates in PowerPoint

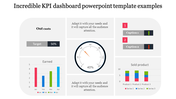
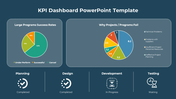
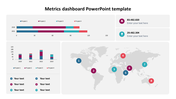
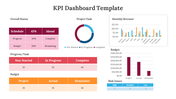
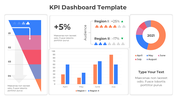
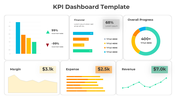
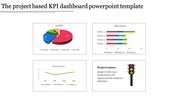
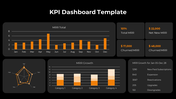
    KPI Dashboard PowerPoint Templates and Google Slides

    Forget data dumps and confusing charts! Our golden-hued KPI Dashboard PowerPoint template is your secret weapon for presentations that shimmer with success. Picture this: a sleek table bathed in vibrant sunshine, where key metrics dance in three elegant nodes. Sales soaring skyward? Profits sparkling? Project milestones gleaming like gold? This dashboard captures them all, transforming raw data into a captivating story of your business achievements. No more squinting at spreadsheets or deciphering graphs. This template serves up your KPIs on a silver platter, clear, concise, and oh-so-beautiful. Your audience will be mesmerized as they track progress, identify trends, and celebrate victories, all under the warm glow of golden yellow. Impress stakeholders, captivate colleagues, and leave a lasting impression. This dynamic tool isn't just a template, it's a spotlight for your success. So, ditch the dull decks and step into the sunshine. Let your data shine with our golden KPI Dashboard and watch your presentations transform into triumphs!

    Features of the template:

    • Slides are available in different nodes & colors.
    • Easy to change the slide colors.
    • Well-crafted template with instant download.
    • 100 % customizable slides and easy to download.
    • Well-crafted template with instant download.
    Advertisement

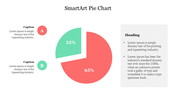
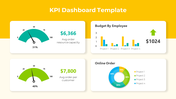
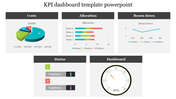
    You May Also Like These PowerPoint Templates

    Add to Wishlist
    Download
    AI Customize
    Timeline charts slides showcasing different stages and tasks across various projects, with color coded bars for each task.
    Free
    Add to Wishlist
    Download
    AI Customize
    Slide with four green donut charts and two horizontal bar graphs showing data comparisons across quarters and months.
    Free
    Add to Wishlist
    Download
    AI Customize
    Illustration of six red bars with corresponding percentages and a businesswoman standing beside them.
    Add to Wishlist
    Download
    AI Customize
    Executive Dashboard slide showing key performance metrics such as revenue vs. target, customer acquisition, and CAC vs. CLV.
    Free
    Add to Wishlist
    Download
    AI Customize
    Dashboard template with a circular speedometer gauge in the center, divided into five blue segments labeled 01 to 05.
    Free
    Add to Wishlist
    Download
    AI Customize
    Colorful project dashboard PPT slide showing a bar chart for four sections with a pie chart detailing percentages.
    Free
    Add to Wishlist
    Download
    AI Customize
    Business strategy chart with blue headers for months, showing green bars representing schedules.
    Add to Wishlist
    Download
    AI Customize
    Stacked bar chart with four vertical bars showing percentages from 2013, 2014, and 2015 in varying green shades.
    Add to Wishlist
    Download
    AI Customize
    KPI slide displaying a financial table for FY 2018, with figures for Net Sales, Income, and Expenses for each quarter.
    Free
    Add to Wishlist
    Download
    AI Customize
    Business plan slide showing bar chart comparing impact of society, customer satisfaction, and people satisfaction.
    Add to Wishlist
    Download
    AI Customize
    Color-coded bars representing business growth from 2015 to 2019, with a percentage line graph above showing a rise.
    Add to Wishlist
    Download
    AI Customize
    Project timeline Gantt chart with color coded bars indicating task descriptions, assigned resources, and milestone markers.
    Add to Wishlist
    Download
    AI Customize
    Data driven financial presentation slide featuring revenue, profit, and customer metrics, along with trend graphs.
    Add to Wishlist
    Download
    AI Customize
    PPT slide displaying various charts including bar charts, pie charts, calendars, and Gantt charts for project tracking.
    Free
    Add to Wishlist
    Download
    AI Customize
    KPI dashboard bar chart slide representing the height of the world's tallest hills with a world map marking their locations.
    Free
    Add to Wishlist
    Download
    AI Customize
    Dashboard infographic with three gauge meters in blue, green, and yellow, each labeled with a number and caption.
    Add to Wishlist
    Download
    AI Customize
    KPI dashboard slide with line chart, showing performance for four categories, along with circular percentage indicators.
    Add to Wishlist
    Download
    AI Customize
    PPT chart with five colorful percentage indicators displayed in curved circular segments, ranging from 30 to 70 percent.
    Add to Wishlist
    Download
    AI Customize
    Speedometer KPI dashboard showing speed readings for three vehicles a truck, a van, and a car.