Free - Editable KPI Dashboard PPT And Google Slides Template
Free


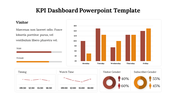

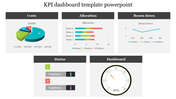
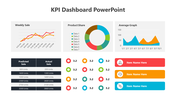
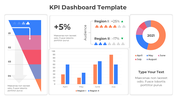
KPI Dashboard Presentation Slide
Embark on a journey to success with our dynamic KPI Dashboard Templates! Picture effortlessly navigating the intricacies of data analysis and performance evaluation, all in one visually captivating dashboard. As the pulse of your business, KPIs illuminate the path to triumph, and our free KPI Dashboard PowerPoint Templates, an abundance of possibilities, are your secret weapon for conquering the competitive landscape. Delve into the realm of productivity with our Excel KPI dashboard templates, a universe of unique solutions awaits to transform raw data into strategic insights. Crafted for the discerning business mind, our meticulously designed Business KPI Dashboard Templates promise a seamless journey from information to impact. Elevate your marketing game with Marketing KPI Dashboard Templates, each a brushstroke on the canvas of success. Navigate the sales landscape effortlessly with Sales KPI Dashboard Templates, your compass in the quest for revenue maximization. And for the tech-savvy, explore the possibilities of Google Data Studio KPI Dashboard Templates, where innovation meets information.
In a world inundated with data, let these templates be your guiding stars. Let the dashboards not just measure but inspire action. Embrace the power within, as success awaits those who seize the insights that lie within these templates. The journey to excellence begins with a single click – revolutionize your approach, empower your decisions, and outshine the competition. Your triumph starts with our KPI Dashboard Templates. Are you ready for the transformation?
Features of the template
- 100% customizable slides and easy to download.
- Slides are available in different colors
- The slide has 4:3 and 16:9 formats.
- Easy to change the slide colors quickly.
- Appealing Presentation to impress an audience.
- Create feature-rich slide presentations.
- An eye-pleasing color slide helps to give a catchy display.
- It is proficient with Google Slides and PowerPoint.


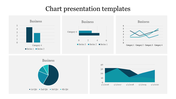
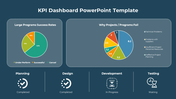
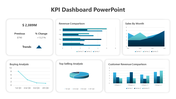
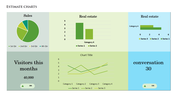
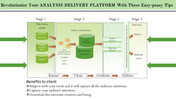
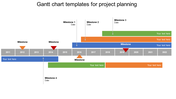
You May Also Like These PowerPoint Templates

Add to Wishlist
Download
Edit

Add to Wishlist
Download
Edit

Add to Wishlist
Download
Edit

Add to Wishlist
Download
Edit


Add to Wishlist
Download
Edit

Add to Wishlist
Download
Edit


Add to Wishlist
Download
Edit

Add to Wishlist
Download
Edit

Add to Wishlist
Download
Edit


Add to Wishlist
Download
Edit

Free
Add to Wishlist
Download
Edit

Free
Add to Wishlist
Download
Edit


