Multicolor Housing Market Cycle PowerPoint Template Design

A colorful housing market cycle graph showing sales over time across purple, blue, teal, and red sections.
P.ID : 47148
    57 views
    2 Downloads
    Get Custom Slides by Experts
    Instantly Access Templates in PowerPoint

    Fantastic Housing Market Cycle Presentation

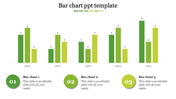
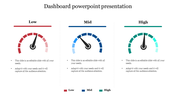
    These models give you the fundamental framework to create a successful communication plan. It focuses on communicating assertions and key messages dependent on sales and the time needed to support them. The introduction facts are explained in the graph. Growth, maturity, and decline in housing are examples of PowerPoint slide designs that can be used to create a strong statement. Typically, it is employed for marketing purposes. Making a message house, for instance, to coordinate marketing materials that are service- or product-focused may be customized by changing the text, background, and colors to match your presentation's theme. For the housing industry, this slide contains inventive narrative techniques. Stories are effective at capturing the needs of the intended audience.

    Features of this Template 

    •  The Slides are available in different nodes & colors.
    •  This slide contains 16:9 and 4:3 formats.
    •  It is easy to change the slide colors quickly.
    •  It is a well-crafted template with an instant download facility 
    •  The best PowerPoint theme template.
    •  It is a  Eye catching Housing Template.
    Advertisement

    You May Also Like These PowerPoint Templates

    Add to Wishlist
    Download
    AI Customize
    Three panel dashboard with column, bar, and funnel charts at the top and numbered blue boxes with text below.
    Free
    Add to Wishlist
    Download
    AI Customize
    3D bar chart PowerPoint template showcasing data in four colored categories with a highlight and captions.
    Free
    Add to Wishlist
    Download
    AI Customize
    KPI dashboard layout with blue semicircle gauges and line charts representing social media performance metrics.
    Free
    Add to Wishlist
    Download
    AI Customize
    Horizontal chart with dual color bars in green and blue, displaying percentage values, and two captions on the right.
    Add to Wishlist
    Download
    AI Customize
    Slide with a vertical bar chart and four labeled sections, each paired with a unique color and icon.
    Add to Wishlist
    Download
    AI Customize
    Dashboard-themed slide with semi-circle charts for business analysis, featuring metrics and reflective silhouettes at the bottom.
    Add to Wishlist
    Download
    AI Customize
    Bar chart infographic with four blue bars for kpi forecasts, a line graph overlay, and a man with a magnifying glass.
    Add to Wishlist
    Download
    AI Customize
    Executive dashboard slide featuring bar graphs and pie charts comparing project data over three years, with text boxes.
    Add to Wishlist
    Download
    AI Customize
    Semi circular gauge in shades of brown and peach with a pointer, alongside text and a silhouette group at the bottom.
    Free
    Add to Wishlist
    Download
    AI Customize
    An executive dashboard showing income and expense distribution, with key financial metrics and a line graph.
    Free
    Add to Wishlist
    Download
    AI Customize
    Market research slide showing a line graph with three levels over the years 2016 and 2019, with a caption box.
    Add to Wishlist
    Download
    AI Customize
    Slide with blue stats on the left and various charts, including bar and pie charts in different colors.
    Add to Wishlist
    Download
    AI Customize
    Comprehensive project dashboard template with progress charts, data bars, and financial performance indicators.
    Free
    Add to Wishlist
    Download
    AI Customize
    A blue themed slide featuring a multi year bar chart comparison from 2016 to 2021 with three placeholders below.
    Free
    Add to Wishlist
    Download
    AI Customize
    3D chart with five colored bars in gold, red, green, teal, and orange, on individual bases, displaying percentages above.
    Add to Wishlist
    Download
    AI Customize
    KPI Dashboard slide displaying metrics with bar charts and line graphs for key business indicators.
    Free
    Add to Wishlist
    Download
    AI Customize
    Five step process chart with titled segments in shades of purple, showing stages and supporting information.