Comparison Chart Template PPT and Google Slides Designs

 Canva
Canva
Comparison Chart Template PowerPoint
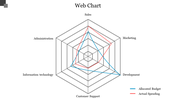
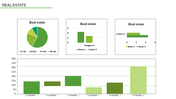
Enhance your analytical presentations with clarity by introducing our Comparison Chart Template PowerPoint. The slide features distinct male and female illustrations. It symbolizes comparative values after thorough analysis. Below the images, a horizontal bar chart represents the analyzed data with clear values. It further offers a straightforward comparison.
Suitable for data analysts, HR professionals and business strategists. An ideal template for showcasing workforce diversity, analyzing survey results or performance disparities. Download today to present comparative metrics, gender analyses or performance evaluations to the target audience.
Features of the template
- The slide contains 16:9 and 4:3 formats.
- Compatible with Google slide themes and PowerPoint.
- 100% customizable slides and easy to download.
- It is easy to change the colors of the slide quickly.
- Well-crafted template with an instant download facility.


You May Also Like These PowerPoint Templates
Add to Wishlist
Download
Edit

Add to Wishlist
Download
Edit

Add to Wishlist
Download
Edit

Add to Wishlist
Download
Edit

Add to Wishlist
Download
Edit

Add to Wishlist
Download
Edit

Add to Wishlist
Download
Edit

Add to Wishlist
Download
Edit

Add to Wishlist
Download
Edit

Add to Wishlist
Download
Edit

Add to Wishlist
Download
Edit


Add to Wishlist
Download
Edit


Add to Wishlist
Download
Edit


Add to Wishlist
Download
Edit

Add to Wishlist
Download
Edit

Add to Wishlist
Download
Edit

