Creative Infographic Waterfall Diagram PowerPoint Template

Pack of 36 slides
P.ID : 68908
Advertisement
671 views
130 Downloads
Get Custom Slides by Experts
Instantly Access Templates in PowerPoint

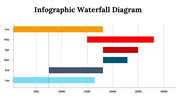
Visually Appealing Waterfall Diagram PPT Presentation Bundle

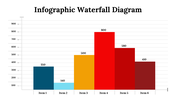
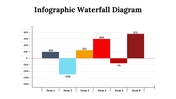
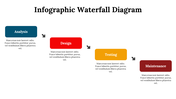
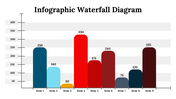
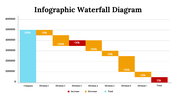
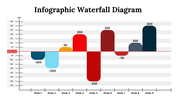
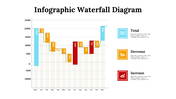
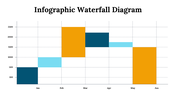
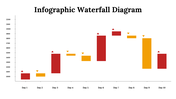
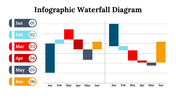
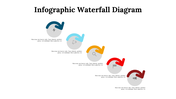
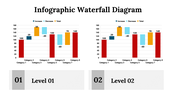
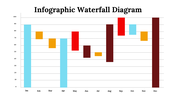
The Waterfall Diagram PPT Template is an ideal tool for giving corporate data in a visually attractive and skilled manner. This pack of Waterfall Diagram PPT Template Bundle with 36 slides is perfect for a visually fascinating data exhibit. It has some themes that may be useful for making visually appealing slideshows, diagrams, and expressions. The templates include configurable colors, fonts, and layouts that can be readily adjusted to your needs and agree with PPT and Google Slides. With this bundle, you'll be able to quickly and effortlessly build cute hints that will charm your audience. Try now!

Features of this Template 

  • 100 % customizable slides and easy to download.
  • Slides are available in different colors.
  • The SlideSlide has 4:3 and 16:9 formats.
  • Easy to change the slide colors quickly.
  • Appealing Presentation to impress an audience.
  • Create feature-rich slide presentations. 
  • An eye-pleasing color slide helps to give a catchy presentation.
  • Crisp and clear font styles and design Presentation.
  • Creative Waterfall presentation slides bundle.

You May Also Like These PowerPoint Templates

Free
Add to Wishlist
Download
AI Customize
Pie chart presentation slide showing three charts with percentages with text placeholders.
Free
Add to Wishlist
Download
AI Customize
Six charts in different formats, including line, pie, bar, and gauge, all in blue and gray, displaying data trends.
Add to Wishlist
Download
AI Customize
Color coded Gantt chart slide outlining a yearly project timeline with quarterly milestones and description boxes.
Add to Wishlist
Download
AI Customize
Circular chart with seven pastel colored segments, each with  icons and captions around it.
Add to Wishlist
Download
AI Customize
Gantt chart slide showing a project timeline with tasks categorized into colorful sections, represented by horizontal bars.
Add to Wishlist
Download
AI Customize
3D bar chart with green, red, yellow, and blue bars for business metrics, with a percentage indicator on the right.
Add to Wishlist
Download
AI Customize
Circular progress indicators in purple, red, blue, and teal, each paired with a percentage and a relevant icon.
Add to Wishlist
Download
AI Customize
Pie chart slide showing budget distribution for facebook, google, and linkedIn ads with respective percentages.
Add to Wishlist
Download
AI Customize
Project management dashboard slide with visually colored charts and graphs displaying task status with icons.
Add to Wishlist
Download
AI Customize
Visual KPI layout with performance bar chart, doughnut chart, and percentage indicators for project analysis.
Add to Wishlist
Download
AI Customize
Dashboard PowerPoint Template and Google Slides
Add to Wishlist
Download
AI Customize
Row of four colored speedometer-style gauges, each showing varying percentages with needle, and captions at the bottom.
Free
Add to Wishlist
Download
AI Customize
Stacked bar chart of the waterfall model with color coded ranges low, mid, and high end across several days.
Add to Wishlist
Download
AI Customize
Three pie charts in brown, blue, and green sections, each with labeled percentages and caption lines.
Free
Add to Wishlist
Download
AI Customize
Multicolored circular pie chart in yellow, red, and green, with labeled categories listed on the right.
Free
Add to Wishlist
Download
AI Customize
KPI dashboard with a data table on the left and a circular chart on the right, featuring shades of teal and white.
Add to Wishlist
Download
AI Customize
KPI themed slide with data visualization including pie charts, bar graphs, line graphs, and key metrics.
Add to Wishlist
Download
AI Customize
Six semicircular gauges with colored indicators in red, purple, blue, yellow, pink, and green on a white backdrop.
Free
Add to Wishlist
Download
AI Customize
Slide showcasing three different types of colored charts an area chart, a bar chart, and a line chart, with captions below.
Add to Wishlist
Download
AI Customize
A waterfall chart with blue, yellow, and red bars shows monthly totals, increases, and decreases, ending at a final point
Add to Wishlist
Download
AI Customize
A slide featuring a waterfall chart, showing data changes in totals, increases, and decreases with textbox in various steps.
Add to Wishlist
Download
AI Customize
IT Waterfall presentation slides featuring step-by-step process charts and placeholder captions in varied colors.
Add to Wishlist
Download
AI Customize
Waterfall Software Development Lifecycle PPT slides featuring colorful flowcharts that outline each stage with icons.
Add to Wishlist
Download
AI Customize
A detailed waterfall process flowchart slides showcasing stages with different colorful layout designs and icons.
Add to Wishlist
Download
AI Customize
Awesome Waterfall Chart Presentation Templates Design
Add to Wishlist
Download
AI Customize
Waterfall chart slide with eight multiple colored bars representing different values and captions below.
Add to Wishlist
Download
AI Customize
Waterfall PPT template with a bar chart showing monthly data from January to June in different colors on a white backdrop.
Add to Wishlist
Download
AI Customize
Waterfall Chart Infographics PowerPoint And Google Slides
Add to Wishlist
Download
AI Customize
A waterfall chart slide displaying monthly data from january to june with captions on the right.
Add to Wishlist
Download
AI Customize
Waterfall chart slide with three vertical bars in orange, blue, and pink, with captions in a legend at the bottom.