Awesome Waterfall Chart Presentation Templates Design

Awesome Waterfall Chart Presentation Templates Design
P.ID : 53886
    36 slides
    Project Planning template displaying multiple slides with charts, timelines, and process steps for structured planning.
    21 slides
    Project proposal slides featuring red and orange theme, with sections for agenda, features, SWOT analysis, and team details.
    16 slides
    Sequence diagram slides showcasing an event request flow from initiation to calendar alert with multiple steps with icons.
    77 views
    17 Downloads
    Get Custom Slides by Experts
    Instantly Access Templates in PowerPoint

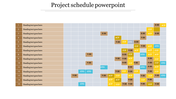
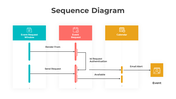
    Graphical Representation Of Your Work:


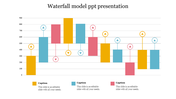
    Share your informative facts and points using this chart inserted template. You can get these waterfall chart presentation templates from our SlideEgg website at an affordable cost by using flexible options provided from us. This whole template can be used in sharing your points in a more extraordinary and informative manner. 

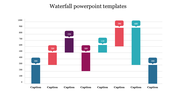
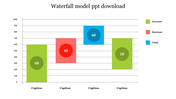
    The graph is presented here as  nodes and bar diagrams which are represented in colorful shades filled inside them. The whole template can be illustrated in an exaggerated manner by using the representation given here. These waterfall chart presentation templates makes your more extraordinary and outstanding so don't miss this template for it as many benefits in them. You can get these at an affordable cost and add them according to your needs using our user-friendly options.

    Features Of This Template:

    • 100% customizable slides and easy to download
    • Slides are available in different nodes & colors.
    • The slides contained 16:9 and 4:3 format.
    • Easy to change the slide colors quickly.
    • Well-crafted Template with instant download facility.
    • Crisp and elegant font style. 
    • The best Template with attractive nodes
    Advertisement

    You May Also Like These PowerPoint Templates

    Add to Wishlist
    Download
    AI Customize
    IT Waterfall presentation slides featuring step-by-step process charts and placeholder captions in varied colors.
    Add to Wishlist
    Download
    AI Customize
    Waterfall Software Development Lifecycle PPT slides featuring colorful flowcharts that outline each stage with icons.
    Add to Wishlist
    Download
    AI Customize
    A detailed waterfall process flowchart slides showcasing stages with different colorful layout designs and icons.
    Add to Wishlist
    Download
    AI Customize
    Awesome Waterfall Chart Presentation Templates Design
    Add to Wishlist
    Download
    AI Customize
    Waterfall chart slide with eight multiple colored bars representing different values and captions below.
    Add to Wishlist
    Download
    AI Customize
    Best Waterfall In PowerPoint Presentation Slide Designs
    Add to Wishlist
    Download
    AI Customize
    Waterfall PPT template with a bar chart showing monthly data from January to June in different colors on a white backdrop.
    Add to Wishlist
    Download
    AI Customize
    Waterfall Chart Infographics PowerPoint And Google Slides
    Add to Wishlist
    Download
    AI Customize
    A waterfall chart slide displaying monthly data from january to june with captions on the right.
    Add to Wishlist
    Download
    AI Customize
    Waterfall chart slide with three vertical bars in orange, blue, and pink, with captions in a legend at the bottom.
    Free
    Add to Wishlist
    Download
    AI Customize
    Colorful waterfall chart slide displaying increases and decreases across eight categories, with corresponding captions.
    Add to Wishlist
    Download
    AI Customize
    Waterfall chart with blue and yellow bars for annual changes, featuring placeholders for increase, decrease, and total.
    Add to Wishlist
    Download
    AI Customize
    Waterfall chart showing data fluctuations across 10 days with purple and pink bars and triangles.
    Free
    Add to Wishlist
    Download
    AI Customize
    Stacked bar chart of the waterfall model with color coded ranges low, mid, and high end across several days.
    Add to Wishlist
    Download
    AI Customize
    A waterfall chart with blue, yellow, and red bars shows monthly totals, increases, and decreases, ending at a final point
    Add to Wishlist
    Download
    AI Customize
    A slide featuring a waterfall chart, showing data changes in totals, increases, and decreases with textbox in various steps.
    Add to Wishlist
    Download
    AI Customize
    Waterfall PowerPoint chart displaying increases and decreases for eight items with color coded bars for each change.